Tag Archives: ENSO

Walker Circulation study is a damp squib for climate worriers, contradicts models

From Tallbloke’s Talkshop

August 25, 2023 by oldbrew

Walker Circulation – El Niño conditions [image credit: NOAA]

The paper this article is based on informs us that ‘The Pacific Walker circulation (PWC) has an outsized influence on weather and climate worldwide. Yet the PWC response to external forcings is unclear’. Under a headline saying: ‘Greenhouse gases are changing air flow over the Pacific Ocean, raising Australia’s risks of extreme weather’, the article here offers almost nothing to support an argument for any human-caused climate effects ‘in the industrial era’. The paper is somewhat embarrassing for climate models: ‘Most climate models predict that the PWC will ultimately weaken in response to global warming. However, the PWC strengthened from 1992 to 2011, suggesting a significant role for anthropogenic and/or volcanic aerosol forcing, or internal variability’. So that role could be anything or nothing, but the models trended the wrong way anyway. The search for ‘anthropogenic fingerprints’ continues.
– – –
After a rare three-year La Niña event brought heavy rain and flooding to eastern Australia in 2020-22, we’re now bracing for the heat and drought of El Niño at the opposite end of the spectrum, says The Conversation (via Phys.org).

But while the World Meteorological Organization has declared an El Niño event is underway, Australia’s Bureau of Meteorology is yet to make a similar declaration. Instead, the Bureau remains on “El Niño alert.”

The reason for this discrepancy is what’s called the Pacific Walker Circulation. The pattern and strength of air flows over the Pacific Ocean, combined with sea surface temperatures, determines whether Australia experiences El Niño or La Niña events.

In our new research, published in the journal Nature, we asked whether the buildup of greenhouse gases in the atmosphere had affected the Walker Circulation. We found the overall strength hasn’t changed yet, but instead, the year-to-year behavior is different.

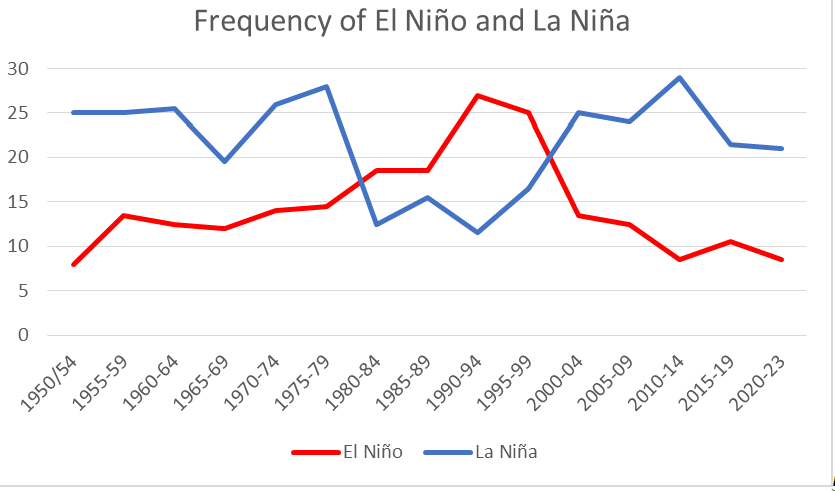
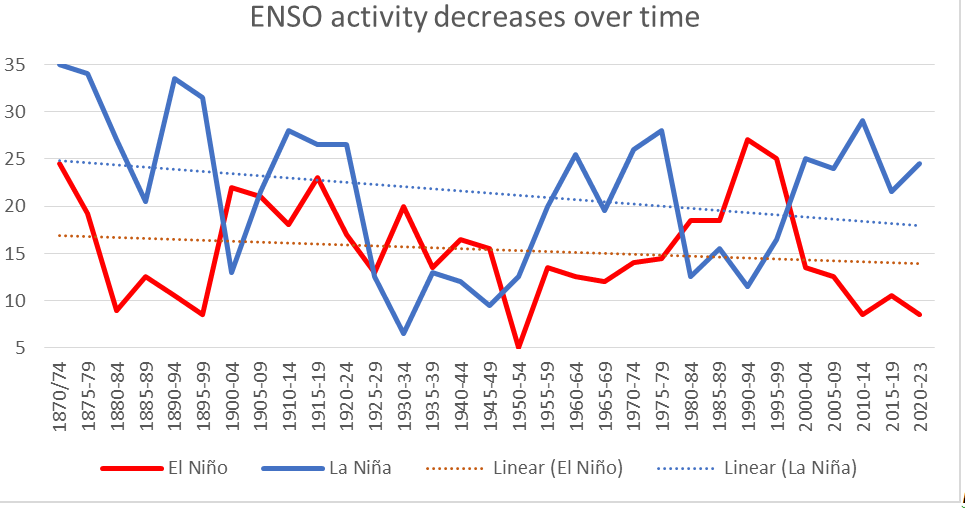
Switching between El Niño and La Niña conditions has slowed over the industrial era. That means in the future we could see more of these multi-year La Niña or El Niño type events. So we need to prepare for greater risks of floods, drought and fire. [Talkshop comment – alarmist psychobabble].

An ocean-atmosphere climate system

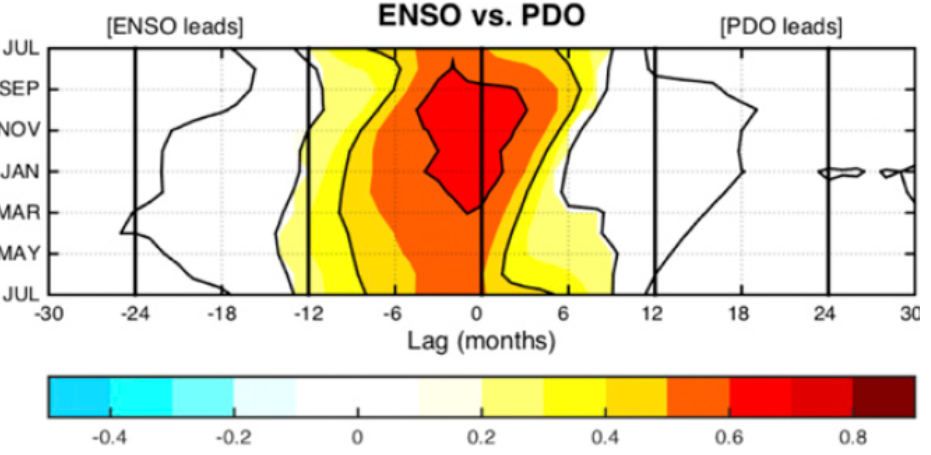
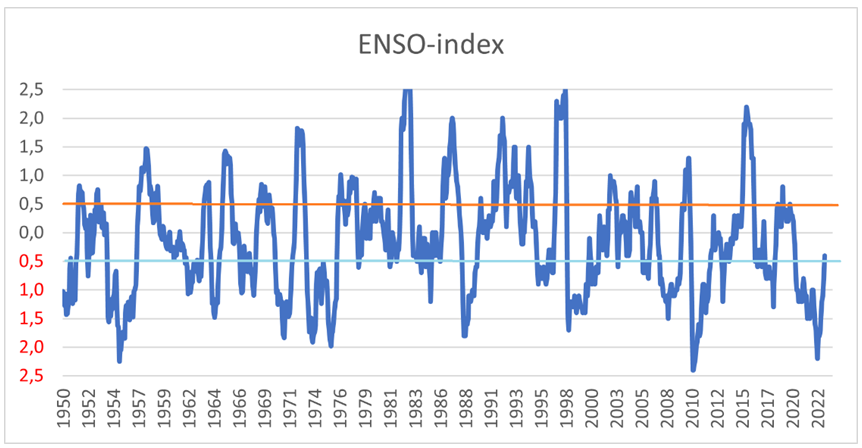
La Niña and its counterpart El Niño are the two extremes of the El Niño Southern Oscillation—a coupled ocean-atmosphere system that plays a major role in global climate variability.

The Walker Circulation is the atmospheric part. Air rises over the Indo-Pacific Warm Pool (a region of the ocean that stays warm year-round) and flows eastward high in the atmosphere. Then it sinks back to the surface over the eastern equatorial Pacific and flows back to the west along the surface, forming the Pacific trade winds. In short, it loops in an east-west direction across the equatorial Pacific Ocean.

But the Walker Circulation doesn’t always flow with the same intensity—sometimes it is stronger, and sometimes it is weaker.

So far, the Walker Circulation is what’s missing from the current El Niño event developing in the Pacific Ocean: it has not weakened enough for the Bureau to declare an El Niño event.

What’s happening to the Walker Circulation?

The Walker Circulation is a major influence on weather and climate in many places around the world, not just Australia.

A stronger-than-usual Walker Circulation even contributed to the “global warming slowdown” of the early 2000s. This is because a stronger Walker Circulation is often associated with slightly cooler global temperature.

So we need to know how it is going to behave in the future. To do that, we first need to know if—and if so, how—the Walker Circulation’s behavior has changed due to human activities. And to do that, we need information about how the Walker Circulation behaved before humans started affecting the climate system. [Talkshop comment – unsupported assertion].

We reconstructed Walker Circulation variability over the past millennium. We used global data from ice cores, trees, lakes, corals and caves to build a picture of how the Walker Circulation changed over time.

We found that on average, there has not yet been any industrial-era change in the strength of the Walker Circulation.

This was surprising, because computer simulations of Earth’s climate generally suggest global warming will ultimately cause a weaker, or

more El Niño-like, Walker Circulation.

Full article here..
– – –
Research paper: Forced changes in the Pacific Walker circulation over the past millennium (Aug. 2023)

Are ENSO Regime Changes Connected To Major Climate Shifts? Are We Tipping To Cooling?

From NoTricksZone

By P Gosselin on 19. April 2023

By Gabriel Oxenstierna

We’ve had a La Niña for nearly three years. But now it has officially ended, and ENSO has moved into its neutral phase, the “La Nada”.[1] The La Niña event lasted three winters in a row, something that has only occurred twice before in modern times: 1973–1976 and 1998–2001. Both of these followed in response to a very strong El Niño.

The La Niña that has now ended, on the other hand, came after the more neutral winter of 2019/20.

Figure 1. Number of months with each ENSO phase for five-year periods from 1950 – 2023

The number of months that we have had each ENSO phase in the last 74 years is shown in Figure 1. The La Niñas are more frequent than the El Niños. Interestingly, the opposite was true during the rapid warming we had from 1975 – 1999, when El Niños were more common. But then it reverts back again around 1998/99. Is there a pattern here?

It is established in climate science that the climate underwent a profound shift in 1976/77, related to the ocean currents.[2] In IPCC AR4, they write: “The 1976–1977 climate shift in the Pacific, associated with a phase change in the PDO from negative to positive, was associated with significant changes in ENSO evolution.” The Pacific Decadal Oscillation (PDO) shifted from a ‘cold’ to a ‘warm’ phase during these two years.[3] The ENSO also became dominated by the El Niño phase, which is characterized by warmer temperatures.[4] These changes affected the global climate, and a rapid warming began.

But what happened in the years just before 2000? As seen in Figure 1, ENSO reverts to being dominated by the ‘colder’ La Niña at that time.

Figure 2. The PDO index according to NOAA/ESRL.

Interestingly, the PDO also reverts to its cold phase in 1998–1999.

Are we seeing a shift to a colder phase in the climate here?

To analyze this confluence, we need to look at longer time series. Luckily, there is monthly ENSO data back to 1871.[5] In Figure 3 I have plotted the number of months of each active ENSO phase, collated in 5-year periods.

Figure 3. Number of months with the respective ENSO phase, and trend lines. Five-year periods from 1871 to 2023.

An oft-repeated forecast is that global warming will lead to more frequent and stronger El Niños, and a generally more active ENSO.[6][7]

However, we see no signs of this in the empirical evidence. On the contrary, the trend is in long-term decline for both ENSO phases.

Figure 4. De-trended, cumulative total of the MEI ENSO index from 1871–2023. Approximate turning points of the PDO are marked with arrows.

The longer-term natural variation for ENSO is clearly seen if we look at the cumulative total of the MEI coefficient in Figure 4. MEI varies around zero, it is positive when we have El Niño and negative for La Niña. The cumulative total is what we get when we start with the first value, and then add each succeeding value to the previous total. The advantage of using the cumulative total is that it lays bare the timing of the fundamental shifts in the system.

We see that ENSO has two distinct long-term states: up or down.
Furthermore, the shift from one to the other seems to be threshold-based.

We have a negative cumulative ENSO trend from 1871–1920 since those years saw a strong dominance of La Niña events. During this period, global temperatures were declining.

In contrast, the period 1920–1944 saw a rapid increase in temperatures and is dominated by El Niño events, as seen in Figure 3. Then comes the cold period from 1945–75, dominated by La Niña events and a declining cumulative ENSO index. After that we have a positive trend until 1997/98, with a rapid increase in global temperatures.

Interestingly, these turning points in ENSO coincide with the reversal of the long-term PDO (marked by arrows in the figure).

Figure 5. ENSO often leads the PDO, especially in the La Niña phase.

That ENSO and PDO are climatically connected is well known. Usually, it’s the ENSO that leads the shifts in the PDO cycle, see Figure 3d in [4].

The standard explanation for the 1976/77 climate shift is that the period before that was cold due to a lot of aerosols in the atmosphere that reduced the amount of warming solar radiation.[8] But around those years, the warming forcing from CO2 took over the cooling aerosols, the narrative goes.

Cannot be explained by CO2

CO2 has been increasing monotonically throughout the modern era, and aerosols increased monotonically up until about 1980.[9] Thus, it is unreasonable that more than one of the climate shifts in the modern era can be explained by the relationship of CO2 to aerosols.

It is more likely that climate shifts are due to confluences between different natural variations that we can observe in various climate indices. We can see, for example, that also the long-term variations in the AMO and SOI show similar turning points to the cumulative ENSO and the PDO, as in figure 4.[3]

Are we currently in a shift towards a colder climate?

One indication of that, is that we’re still quite far away from the previously observed threshold levels in the cumulative ENSO index.

A note on ENSO indexes

The ENSO variation between La Niña/Neutral/El Niño is defined by different indices. The traditional one is called NINO 3.4, which picks up temperature differences in two regions in the Pacific ocean. If the average value is below -0.5 degrees three months in a row, it is classified as La Niña, above 0.5 it is El Niño, where the numbers refer to the temperature deviation in two areas of the Pacific Ocean.

The MEI.v2, which is used in this article, is an alternative index, which weighs together five different variables: sea surface air pressure, sea surface temperature, zonal and meridional components of the surface wind, and outgoing longwave radiation.

The MEI uses the same numerical scale as for Nino 3.4, but the amplitude differs. MEI.v2 exists from 1979 and the earlier MEI index exists from 1950, and in a reconstruction back to 1871. This is what the raw data looks like for the MEI.v2 index:

References

[1] El Niño and La Niña Alert Systemhttps://www.climate.gov/news-features/blogs/march-2023-enso-update-no-more-la-ni%C3%B1a see also:
https://www.cpc.ncep.noaa.gov/products/analysis_monitoring/enso_advisory/ensodisc.shtml

[2] The 1976-77 Climate Shift of the Pacific Ocean, Miller and 4 co-authors, 1994, Oceanography, https://doi.org/10.5670/oceanog.1994.11

[3] A new dynamical mechanism for major climate shifts, Tsonis and 4 co-authors, https://doi.org/10.1029/2007GL030288

[4] The Pacific Decadal Oscillation, Revisited, Newman and 14 co-authors, Journal of Climate 2016, https://doi.org/10.1175/JCLI-D-15-0508.1

[5] Data from NOAA. https://psl.noaa.gov/enso/mei.ext/table.ext.html
Enso has also been reconstructed for the latter half of the Holocene, about 6000 years back in time: Changes in ENSO Activity During the Last 6,000 Years Modulated by Background Climate State, Soon-Il An and 2 co-authors, https://www.docdroid.net/QmS34GN/101002-at-2017gl076250.pdf

[6] Emergence of climate change in the tropical Pacific, Ying and 6 co-authors, Nature 2022, https://doi.org/10.1038/s41558-022-01301-z

[7] Increased ENSO sea surface temperature variability under four IPCC emission scenarios, Cai and 5 co-authors, Nature 2022, https://doi.org/10.1038/s41558-022-01282-z

[8] See, for example, the article at Skeptical Science, Why did climate cool in the mid-20th Century?https://skepticalscience.com/global-cooling-mid-20th-century-advanced.htm

[9] Rethinking the Lower Bound on Aerosol Radiative Forcing, B. Stevens, 2015, https://10.1175/JCLI-D-14-00656.1