

From Watts Up With That?
By Richard Willoughby

Summary
This article examines Earth’s position in relationship to the Sun as well as solar activity in high spatial and temporal detail across the globe to better understand how the Sun influences weather and climate change.
Daily sunlight data across latitudes is compared with observed trends to give insight into why the climate changes.
Poleward advection of heat from the Equator is covered in detail and used to understand why more ocean heat is being retained in the high condensing zones of both hemispheres.
A simple matrix of Earth’s climate zones and annual seasons is shown to provide a coherent basis for comparing seasonal solar changes from period to period and even year-to-year to understand climate trends and seasonal weather shifts.
Introduction
Earth’s orbit around the barycentre of the solar system and the Sun’s movement relative to the barycenter causes a continually evolving geometric relationship between Earth and Sun.
The geometry of the relationship can be reduced to two variables at any point in time – the distance between their respective centres and the declination of Earth’s equatorial plane to the line between Earth and Sun.
These two variables can be used to calculate the solar electro-magnetic radiation (EMR) reaching the top of Earth’s atmosphere (ToA) and its zenith angle at any latitude on Earth for any specified time.
Distance Earth to Sun
NASA JPL provides daily declination and distance data through the Horizons portal. Chart 1 shows how the daily distance between Earth and Sun has changed relative to the corresponding day in 1920 for the period 1980 to 2030.


Declination of Earth Equatorial Plane relative to Line to Sun
Earth’s axis is tilted relative to its orbital plane causing an observer on Earth to see the Sun daily zenith angle change over a yearly cycle. An observer on the Equator sees the Sun directly overhead on March equinox and September equinox. The maximum northern tilt of the axis toward the Sun occurs on the June solstice while the maximum southern tilt toward the Sun occurs on the December equinox.
Jupiter’s movement around the solar system is in an orbital plane that is not completely aligned with Earth’s orbital plane.
The consequence of this is that both the Sun and Earth move north and south relative to Earth’s average orbital plane. This out of plane variation in orbit results in slight variation of solar zenith declination to Earth’s surface to a greater degree than just the axis tilt relative to the line of the Sun in an annual cycle. Chart 3 shows the variation in daily declination angle from 1980 to 2030 relative to 1920.

Solar Constant
The power output of the Sun is relatively stable but not quite constant. The power output has some similarity to the frequency of sunspots and sunspots have been used in the past as a proxy for the cyclic change in solar constant.
However, a satellite-based monitoring program was established in 2003 and operated to 2019 to provide actual data outside Earth’s atmosphere that was then corrected for Sun-Earth distance to arrive at a measured, distance corrected value for the solar constant.
Chart 4 includes the measured data as well as calculated values from correlation with the Solar magnetic field. This solar constant data series is known as SATIRE-S.

Trends in Solar Intensity across Latitudes
Knowing the Sun-Earth distance, the declination and the solar constant on a daily basis provides sufficient data to hindcast and forecast the average ToA solar intensity for any latitude for any day. Chart 5 provides an example of the trend in maximum daily average solar intensity at 10N.

Chart 6 shows solar intensity at 80S for day 295 of each year, which is the latitude and day with the greatest upward trend for daily average solar intensity due to its high sensitivity to changes in declination.

Chart 7 shows the trend in maximum and minimum solar intensity across the latitudes.

If anyone was looking for a cooling surface temperature trend, then the best place would be to look south of 45S per Chart 8.

Chart 9 shows the day of the year for each hemisphere across the latitudes with the highest positive and negative trends.
Both polar regions have higher trends than the tropics with near symmetrical up and down trends in the hemispheres but not quite symmetrical between the hemispheres.
The southern hemisphere polar regions have larger up and down trend than the northern hemisphere.

Trends Driving Changes in Poleward Advection
Heat advection from the tropics to the poles is a significant factor responsible for observed weather, climate and climate change.
The seasonal variation in sunlight is the primary driver of the poleward advection of tropical heat. Advection is the result of heat being accumulated in the tropical zones of each hemisphere being transported poleward to cooler temperature and polar zones of each hemisphere.
In this example, peak solar intensity at 10N and 10S are taken as representative of tropical heat uptake and minimum solar intensity at 40N and 40S to be representative of the lowest temperature in the temperature zones that creates the thermal imbalance driving advection.
The following three charts, 10, 11 and 12 display the trends in both hemispheres for the maximum solar intensity at 10N and 10S: the minimum solar intensity at 40N and 40S and the difference for both hemispheres.


Aspects of these charts that are worth noting are:
- All trends are up.
- The maximum solar intensity at 10S is almost 20W/m² higher than 10N.
- The minimum solar intensity at 40N is approximately 10W/m² higher than at 40S.
- The difference in the SH is 30W/m² higher than the difference in the NH.
- The difference in the NH is trending up almost 3 times faster than the trend in difference in the SH.
Given the baseline differences and trends, it is reasonable to expect that advection in the SH would be higher than the NH and both increasing.
The increasing ocean heat content predominantly in the temperate zones of both hemispheres is consistent with these changes in solar intensity per Chart 13.

The increasing precipitation caused by the increasing heat advection is deepening the thermocline and reducing heat loss from the oceans in these regions.
Surface Temperature Response
The surface temperature across hemispheres and specific locations are highly correlated over any annual cycle, allowing for thermal lag. Chart 14 provides the thermal response to monthly solar intensity for the respective hemispheres.

The NH temperature response would be 1.6 times the response of the SH for the same range in solar intensity.
Daily temperature readings are also well correlated to daily solar intensity for any selected location as Chart 15 shows for Low Head in northern Tasmania.

Forecasting Weather & Climate
Being able to hindcast and forecast daily sunlight and trends from past to well into the future provides a sound basis for understanding weather changes from year-to-year and longer-term trends.
For example, boreal winter 2025/26 was bound to have above trend snowfall because the NH had above trend solar intensity from March equinox to July solstice but below trend sunlight from September equinox to December solstice per Chart 16.

From Earth’s perspective, the exposure to solar radiation can be classified into six latitudinal zones and four annual phases. For the purpose of comparison here, the Zones are:
- Northern Hemisphere: Arctic 60N to 90N, Temperate 30N to 60N, Tropical 0N to 30N
- Southern Hemisphere: Antarctic 60S to 90S, Temperate 30S to 90S, Tropical 0S to 30S
The annual phases are taken from December Solstice to March Equinox to June Solstice to September Equinox to December Solstice. The zones and phases can be visualised as a six by four matrix or a six by five matric to include the last phase of the previous year as in Matrix 1.

Hence the reason for the preceding year SH Heating value being included in the matrix. The NH Advection of 4.35W/m² was above trend. Monsoon days is the number of days above 425W/m² on an area average basis for the tropical zone.
Oceans reach their sustainable limit of 30C at and above that solar intensity. Freezing days are based on days 220W/m² and below on an area average basis for the polar regions. Surface level ice and snow are observed below this solar intensity.
The larger increase in monsoon days in the NH is consistent with the higher upward trend in peak solar intensity at 10N compared with 10S.
However, the SH has a higher number of days in monsoon due to the higher solar intensity in the SH.
Matrix 2 provides the changes for 2026 relative to 2025.

Discussion
Determining the daily ToA solar intensity anywhere over Earth can be derived from three variables – distance, declination and solar constant.
All three can be determined for present, past and future with sufficient precision to be useful for understanding seasonal weather and climate trends. Observed climate trends are well correlated to seasonal and temporal changes in solar intensity.
Changes in weather from year-to-year are also readily related to the year-to-year changes in solar intensity.
Increasing global ocean heat retention is the most concrete evidence that Earth is in a warming trend.
Changes in seasonal solar intensity and corresponding increase in poleward advection in both hemispheres readily explain this warming trend.
Increasing poleward advection also explains the increasing snowfall across the NH with 2025/26 winter predicted to have above trend snowfall per Image 1 as an example of heavy snow. Year 2033 will rival 2025 for NH Heating and NH Advection and year 2037 will have higher NH Heating and higher NH Advection than 2025.

The NH has increasing maximum solar intensity across all latitudes and poleward advection will continue to increase with the difference in area average NH Heating and NH Cooling increasing by 5.1W/m² by 2500 over 1980 level.
By then, advection in the SH will be reducing from present level; down by 0.2W/m² in 1980. By the year 3000, NH advection will be 7.4W/m² above 1980 level while SH will be 3.7W/m² below 1980 level.
Rising maximum solar intensity in the NH will continue to cause increasing global average temperature even when the maximum intensity across the SH is declining. This is due to the higher thermal response of the NH compared with the SH.
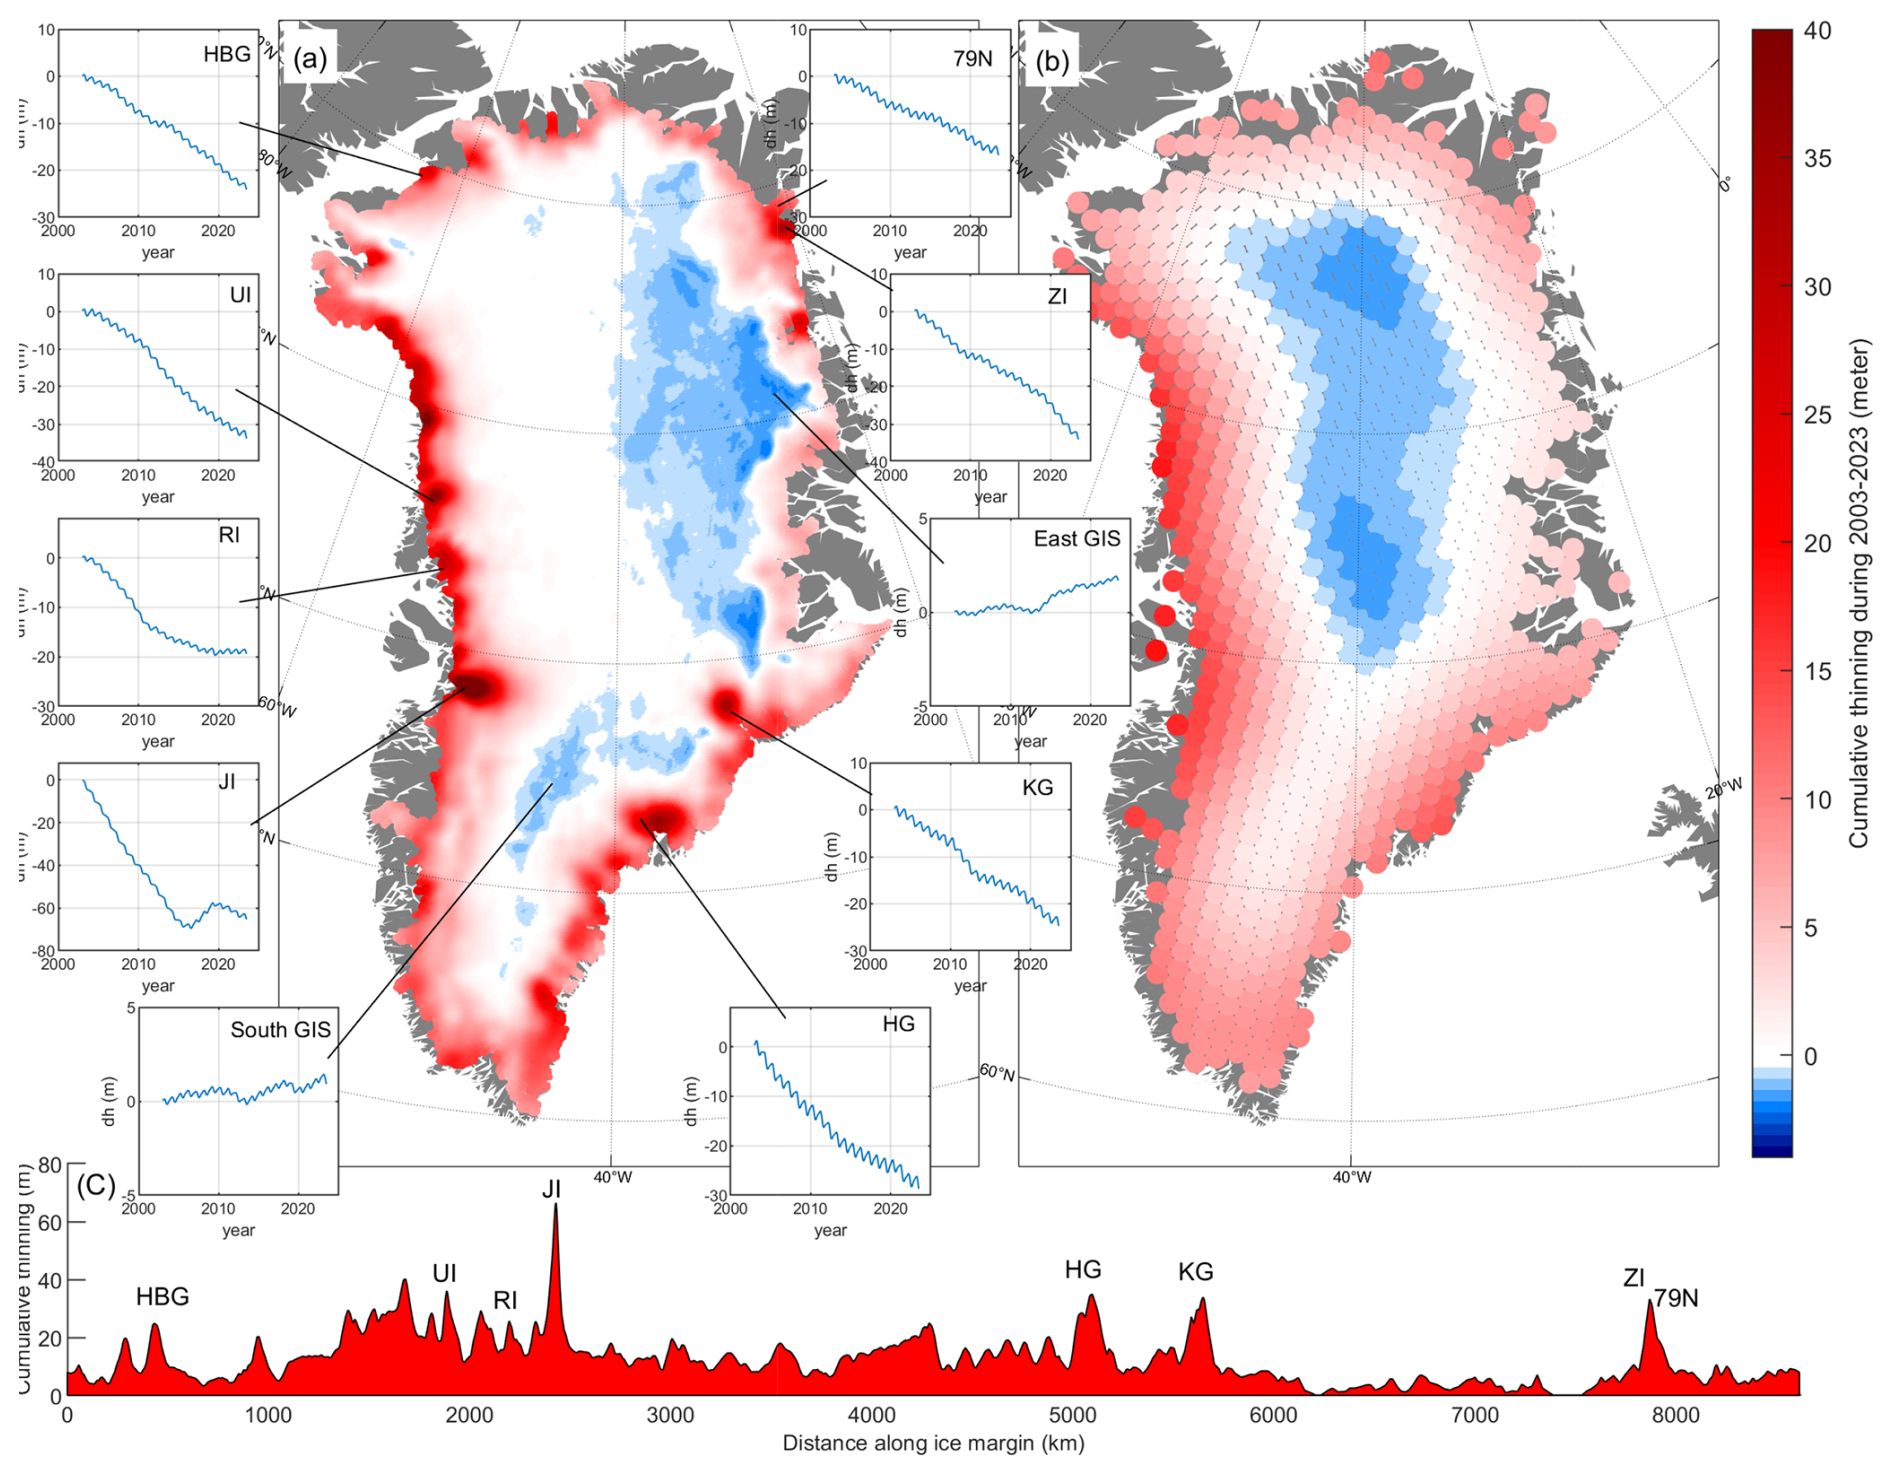
The NH will only cool again once the ice starts advancing south. So far only Greenland is showing ice gains at altitude consistent with eventual re-glaciation of the NH. The central plateau has gained up to 2m this century.
Some observed weather phenomena such as the El Nino/La Nina phases of the Tropical Pacific may be better associated with subtle shifts in sunlight than generally considered.
Chart 17 is an example of exploring this possibility by looking at how convective cells compete across the Tropical North Pacific to cause reversal of trade winds in certain years.
The chart shows the difference in solar intensity at 20N 19 days before the September equinox and 10N 4 days before the equinox compared with the Nino34 index in December.

Conclusion
Rapid human development has occurred during the current interglacial period of the northern hemisphere.
The SH has largely remained glaciated south of 60S. Historical evidence indicates NH interglacials persist for around 12,000 years, which is half the period of Earth’s orbital precession as shown in Chart 18.
Interglacials of the NH terminate when the peak solar intensity in the NH is increasing because liberating water from the ocean and depositing snow on land is an energy intensive process, requiring some 1400kWh per tonne of ice on land.
So, the oceans need to be warm to produce the atmospheric moisture.

All the current climate trends are consistent with approaching re-glaciation of the NH within the current millennium. Accumulation of ice at altitude in high latitudes is an early indicator for the eventual ice accumulation down slope and at lower latitudes.
Greenland’s largest and most productive glacier, Jacobshavn, has advanced and thickened over the past decade.
Energy security and hour-to-hour reliability of energy supplies will be vital for survival of human populations north of 40N living through an era of progressively harsher winters in coming decades and centuries.
The boreal winter of 2025/26 had above trend advection that caused record daily and monthly snowfall in numerous locations. The same conditions of higher than trend summer solar intensity followed by lower than trend winter solar intensity will not be repeated till 2033/34 and will be eclipsed in 2037/38.
The widely held belief that reducing carbon combustion will create perfect weather is a modern cargo cult perpetrated on poorly educated, gullible populations where they fail to examine and understand the evidence.
The Author
Richard Willoughby is a retired electrical engineer having worked in the Australian mining and mineral processing industry for 30 years with roles in large scale operations, corporate R&D and mine development.
A further ten years was spent in the global insurance industry as an engineering risk consultant where he developed an enduring interest in natural catastrophes and changing climate.
Share this:

Discover more from Climate- Science.press
Subscribe to get the latest posts sent to your email.