

From Watts Up With That?

News Brief by Kip Hansen — 2 March 2024
Several times I have had readers at WUWT ask in comments: “If the climate is changing, why haven’t the planting zone maps changed?”
Well, they have and they do. The U.S. Department of Agriculture issues a new U.S.D.A. “Plant Hardiness Zone Map” periodically. A new version of the map was just released on Nov. 15, 2023. I became aware of it because my wife is an avid gardener and follows our local agricultural County Cooperative Extension news.
When she followed the link to the new Plant Hardiness map and checked our very local area, she was surprised to see that it had “warmed” here by 5°F. Here is the bit of the page she was looking at:

She was a bit perplexed by this news, as we have been having not “hot” years but cooler years recently. It took me a minute to sort through it to see that the drop down was not clear on what temperature change they were talking about. That temperature change elevated us one half a zone from zone 5b to zone 6a.
This is what the hardiness map is meant to show, according to the U.S.D.A. [USDA hereafter]:
“USDA’s Plant Hardiness Zone Map is the standard by which gardeners and growers can determine which plants are most likely to thrive at a location.”
“The 2023 map is based on 30-year averages of the lowest annual winter temperatures at specific locations, is divided into 10-degree Fahrenheit zones and further divided into 5-degree Fahrenheit half-zones.”
“The 2023 map incorporates data from 13,412 weather stations compared to the 7,983 that were used for the 2012 map.”
The confusion about “Temperature Change 2012-2023” was that it is not the Global Warming type of change – average surface temperature change – but rather “30-year averages of the lowest annual winter temperatures”. Those of you who follow the odd science of averaging temperatures will see that this type of average gives a common-sense view of the most likely absolutely lowest temperature in a year expected for an area based on a 30-year climatic-period average. What hardiness zones don’t give is the lowest possible temperature.
Why do they track this particular metric?
“Plant hardiness zone designations represent what’s known as the ‘average annual extreme minimum temperature’ at a given location during a particular time period (30 years, in this instance). Put another way, the designations do not reflect the coldest it has ever been or ever will be at a specific location, but simply the average lowest winter temperature for the location over a specified time. Low temperature during the winter is a crucial factor in the survival of plants at specific locations.”
For instance, when we plant gladiolus bulbs [aka “glads”] the usual practice recommended is “In temperate zones, the corms [bulbs] of most species and hybrids should be lifted in autumn and stored over winter in a frost-free place, then replanted in spring.“ But, in our experience, when we have a mild winter, glads that we missed when lifting (digging up) in the Fall, come up in the Spring just fine. We find that aggravating, as it is a lot of work to dig them up if we could have left them in the ground. But…if one fails to lift the bulbs, and we get a hard winter, of which we have had many over the last 30 years, the majority of the glads will be frozen and lost. Now, we find that our “average lowest annual winter temperature” is -10°F to -5°F. In that range, it is possible, maybe with a lot extra care, not to dig them up. But….if we get that winter with -20°F or -10°F for a week running, we’d lose all of the glads still in the ground.
Enter the Hardiness Zone map. For our area, we are on the cusp of being able to leave glads in the ground and needing to dig them up. In the little bit of map above, we see that the green area spreading north along the Hudson River Valley from New York City. The low altitude and the warmer water of the river (comparatively warmer) keep the valley a bit warmer, as for lowest temperatures, than in the rising hills to the west and east.
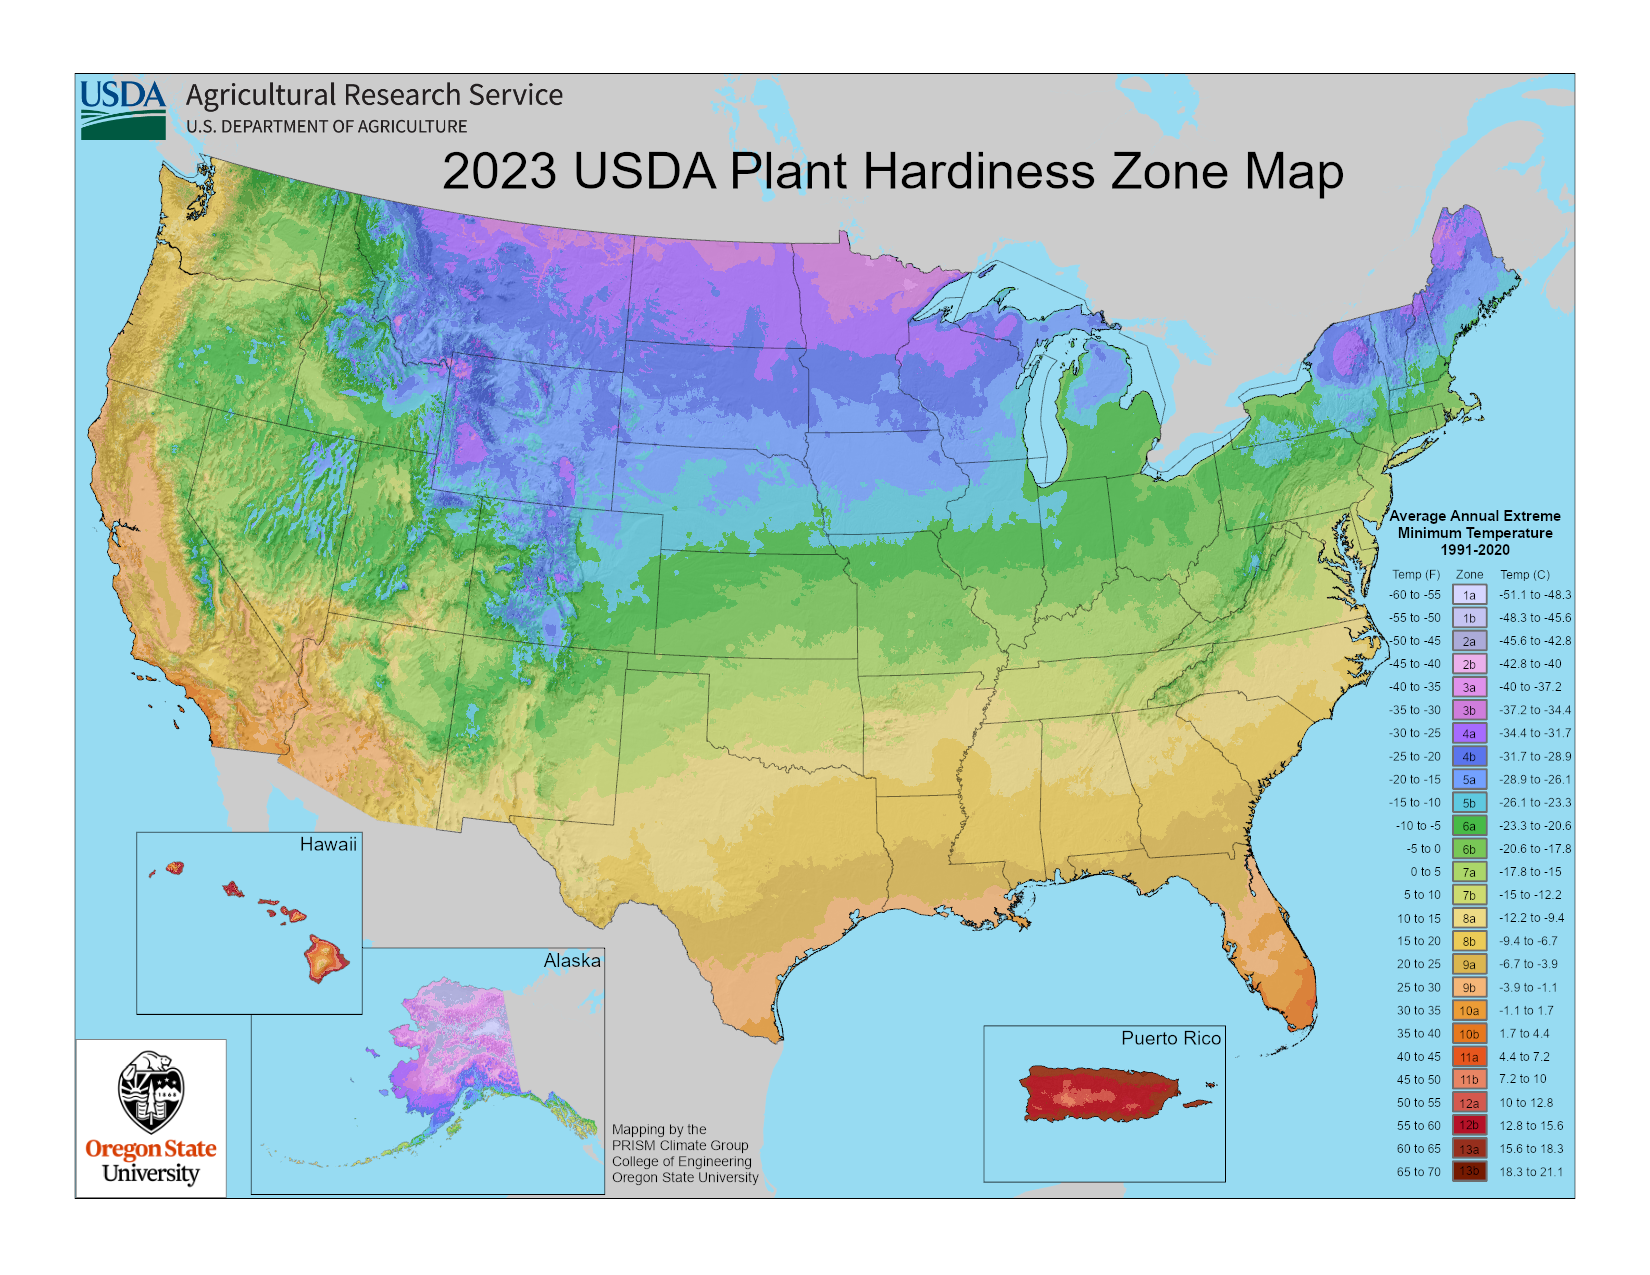
Here is the whole U.S.A.:

If your area is obscured by the drop down in the middle, or you just want to see a larger version – use this link. At the USDA site, you can put in your zip code and the little drop-down report shown. You can see by the index along the right that to be totally safe from frost, temperatures below freezing, you must be in zones 10 or above.
The Arbor Day Foundation has its own versions of Hardiness Maps and interesting comparisons over the last 30 years. Why Arbor Day? “Fruit Trees for Cold Hardiness Zone 4 (Average Minimum Temperature of -30° F/-35° C) — These Apple, Cherry, Peach, Plum, Apricot, Nectarine, Pear, Asian Pear, Almond, and Walnut trees can be expected to grow and thrive in climates rated as being within USDA Cold Hardiness Zone 4. These cold hardy and resilient fruit trees are known to withstand temperatures down to -30°F / -35°C! “ [source] Also see “Orchard Frost – Critical Temperatures for Various Fruits” for common spring temperatures that can ruin orchard crops in my area.
What does all this mean? If one is going to plant expensive garden or landscaping plants, stick to the USDA Hardiness map and give yourself an extra half zone. For me, that would be sticking with my old zone 5b instead of hoping my 6a plants will survive. If I were planting a commercial orchard or nursery, I would fall back of lowest recorded temperatures for the last century or so – averages be hanged.
Personal note: My family has lived in this area for 30 years (albeit, my wife and I flitted off to the Caribbean for a decade and a bit). We have had winters with nary a flake of snow and we have had a winter that remained between -20°F and -10°F, day and night, for a week. Decimated the gardens.
As the planet has slowly come up out of the Little Ice Age, growing conditions in many places have improved with earlier frost-free dates in the Springs and later first-killing-frost dates in the Falls which add up to longer growing seasons. In some areas, this is allowing two dependable crops in the same calendar year. Hardiness Zones reflect this gentle beneficial warming.
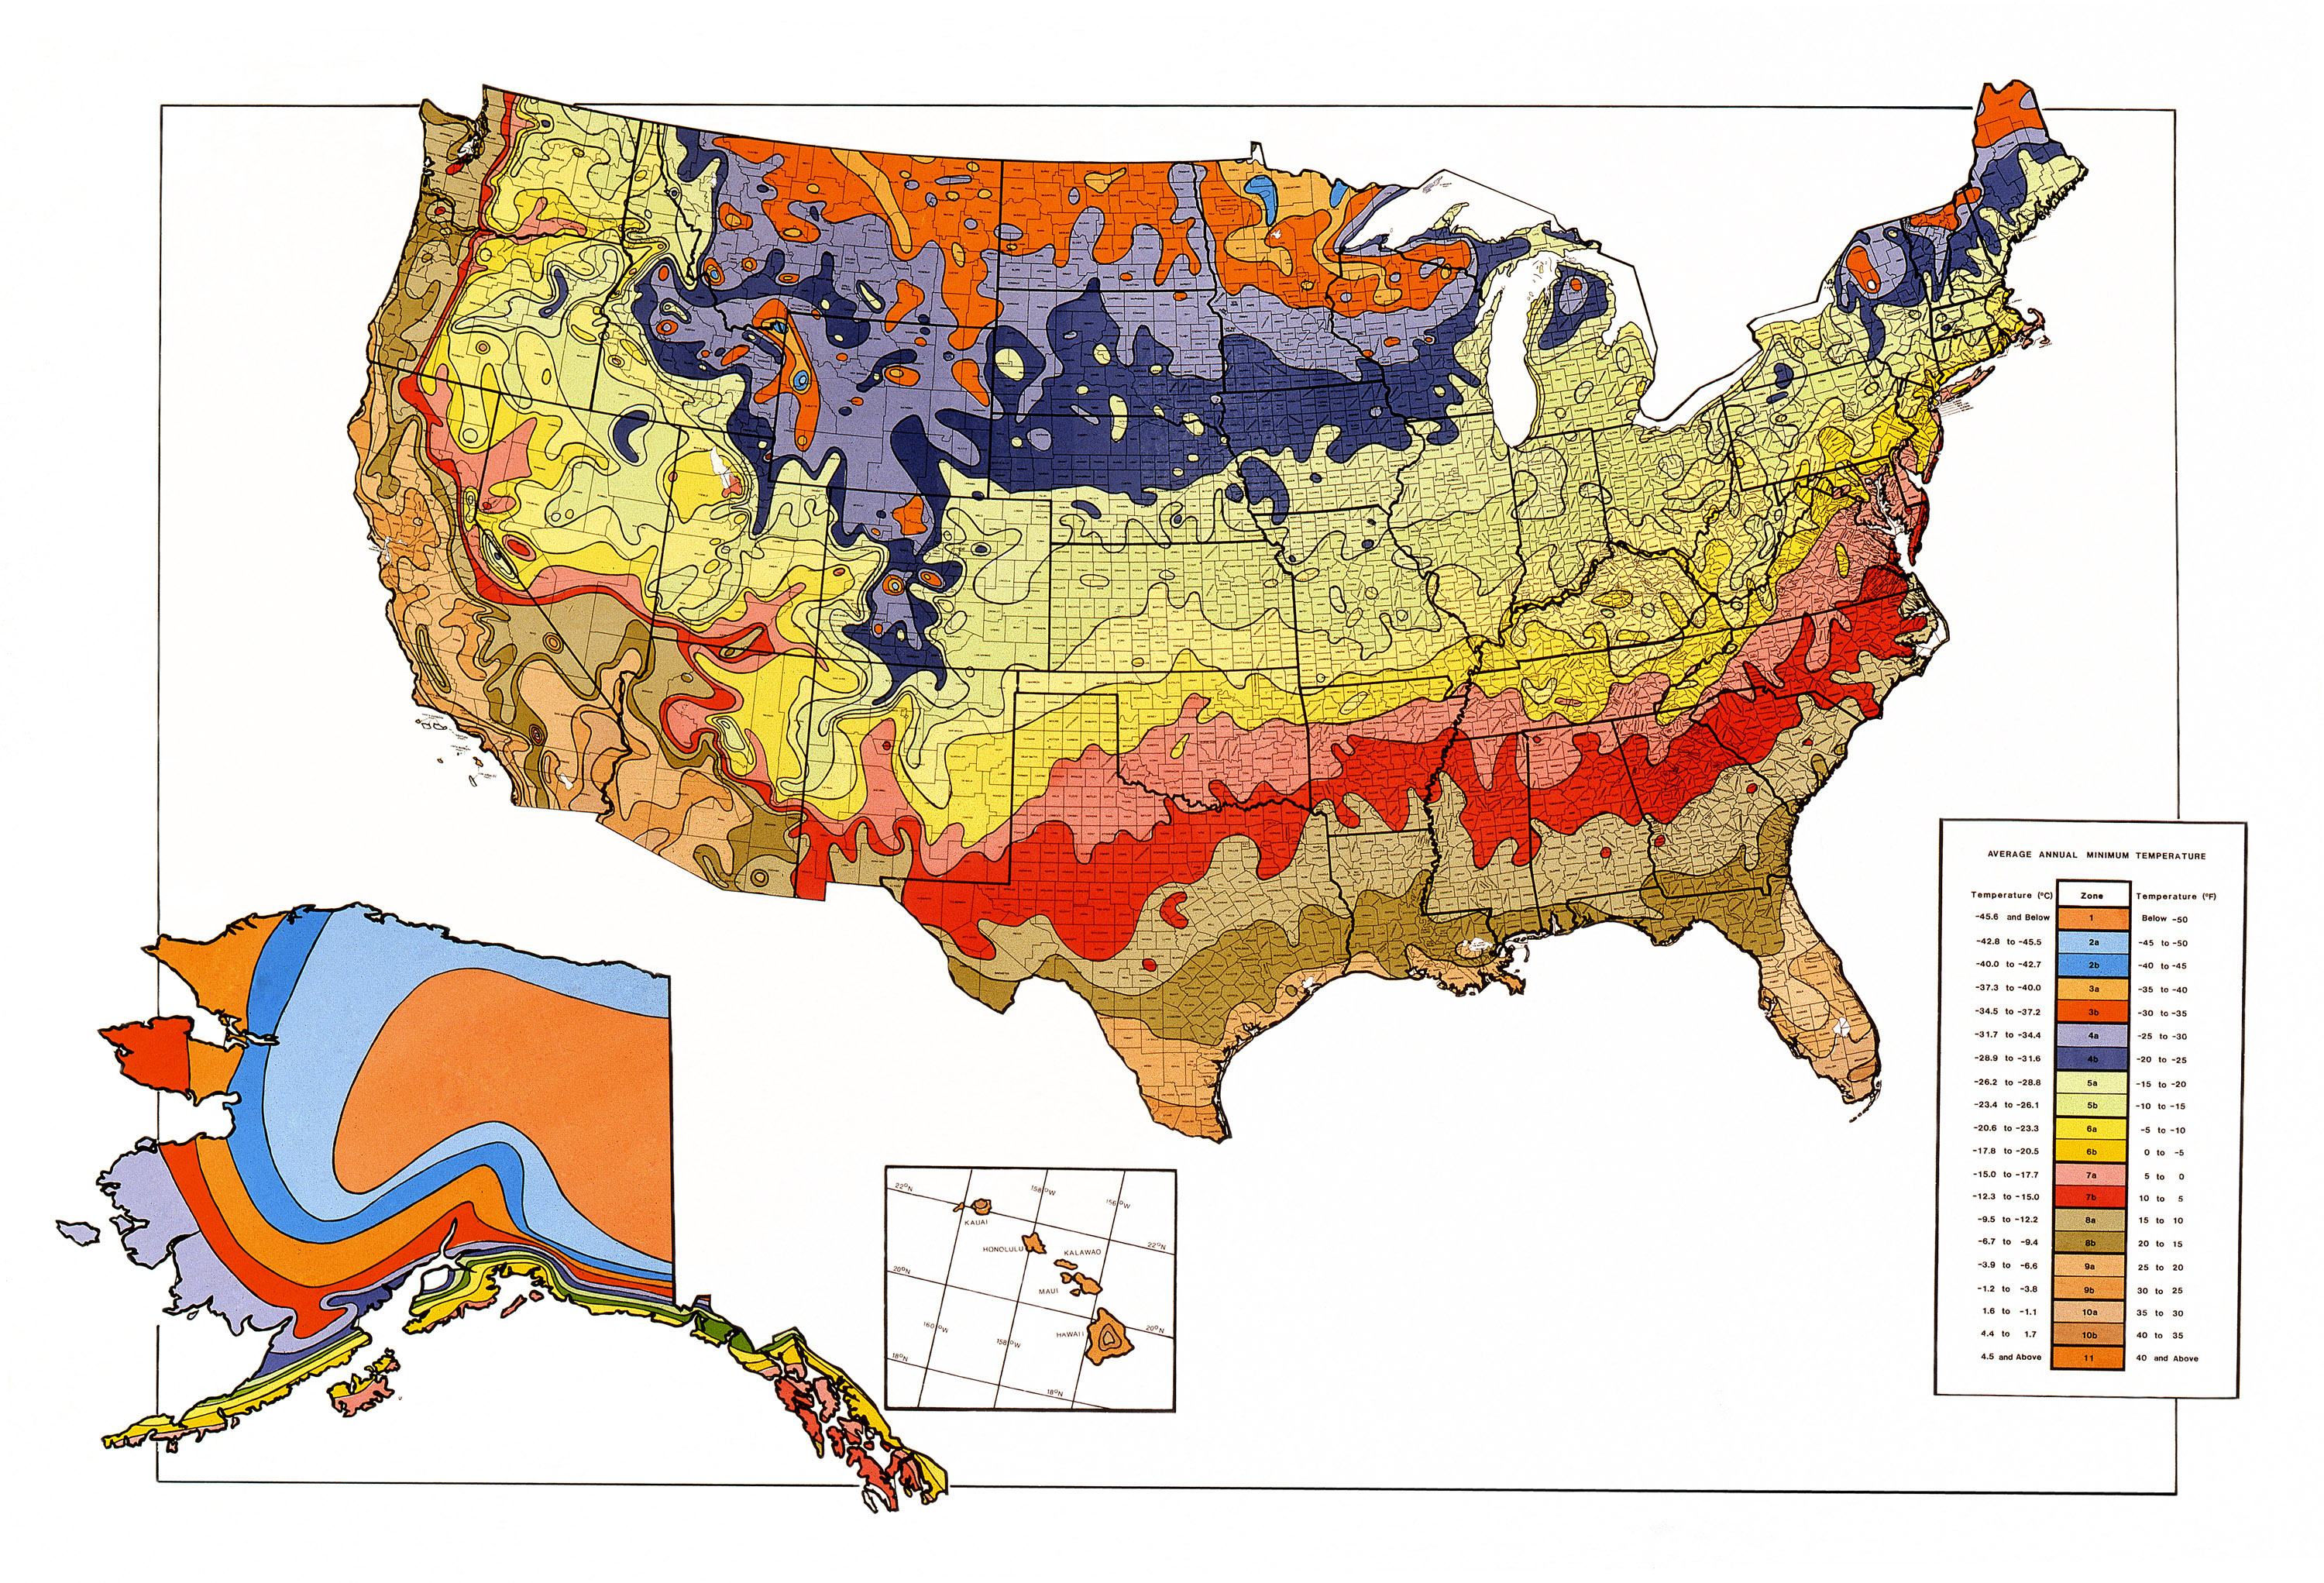
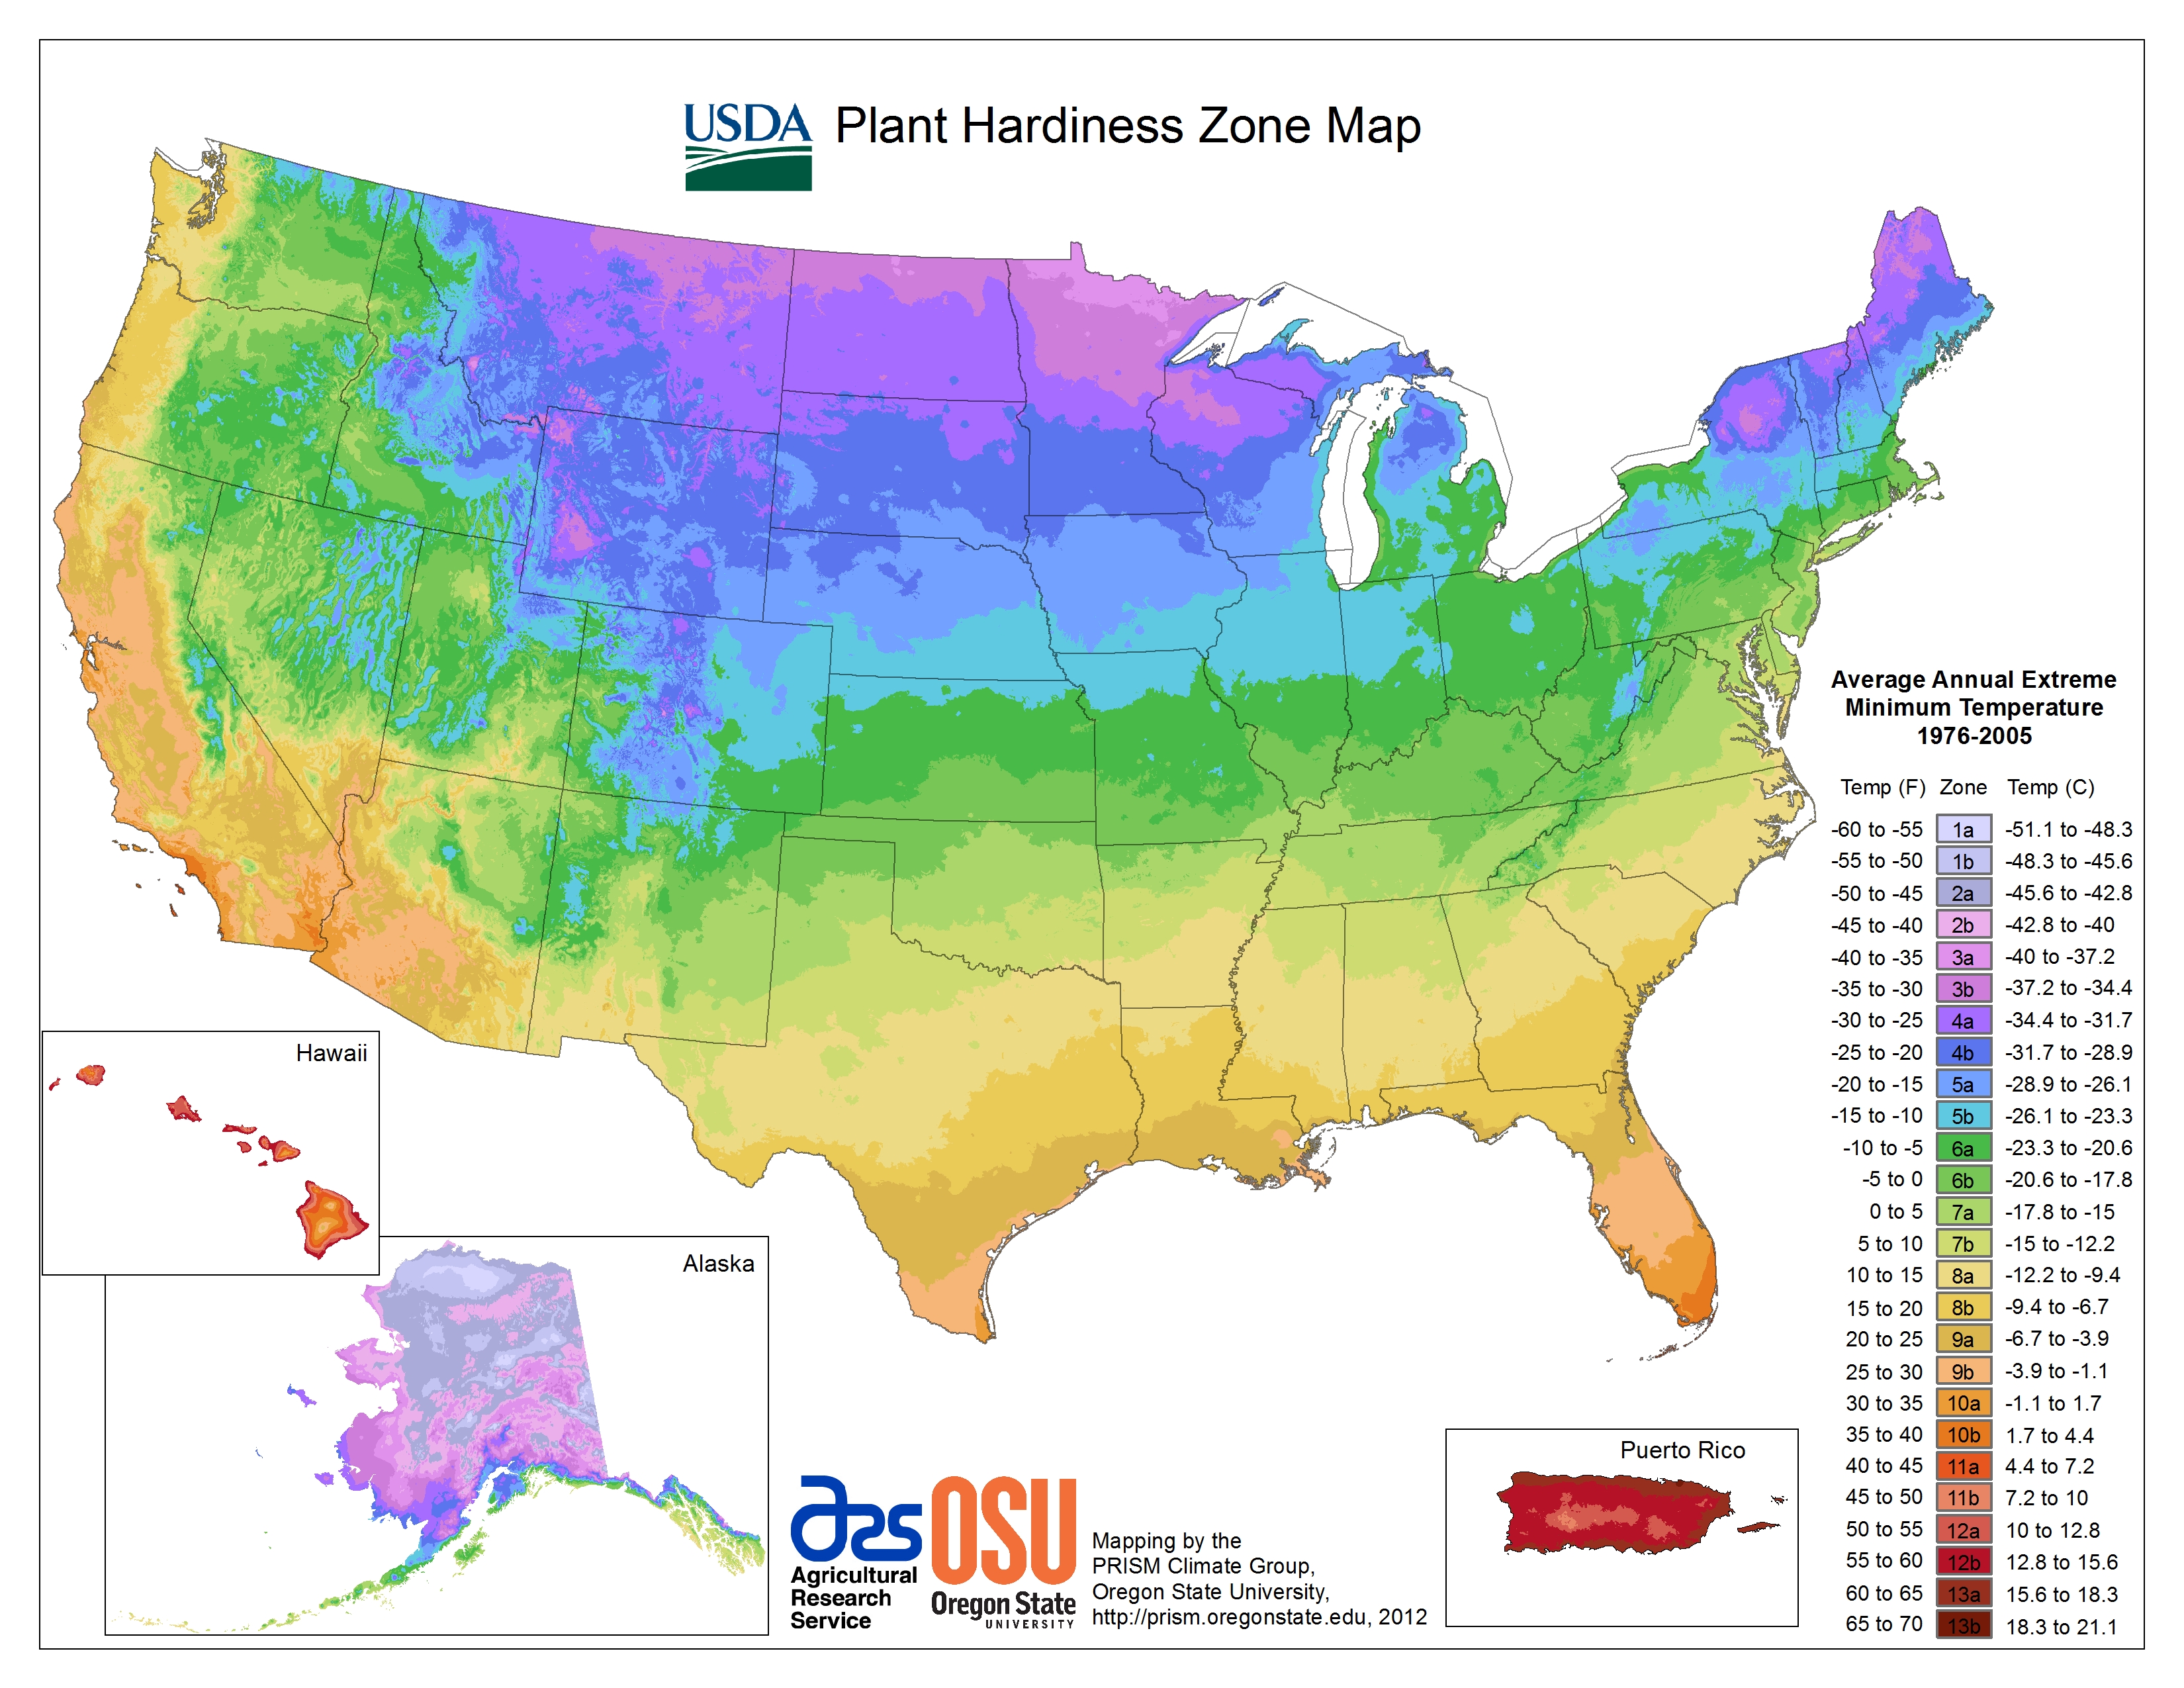
It is important to note that the USDA Hardiness Zones are now based on a great deal more data and are developed at a finer scale than previously. Here I show the 1990, 2012, and 2023 maps, side by side.

links to the maps are: 1990, 2012, 2023.
It is easy to see how coarse the map was for Alaska in the 1990 version. The differences between 2012and 2023 are very hard to see, but they are there. If you are in the United States, use this link and enter your zip code.
Bottom Lines:
1. USDA Hardiness Zones are based on “30-year averages of the lowest annual winter temperatures” – periodically, those values are re-examined and hardiness zones adjusted.
2. The changes in the Hardiness Zones represent only changes in that average.
3. The lengthening of growing seasons are a net positive for the slow gentle warming as the planet comes up out of the Little Ice Age.
# # # # #
Author’s Comment:
Not only are the U.S. Hardiness Zones changing but so are the Koopen Climate Zones – but only in modeled futures. I’ll write about that effort.
Köppen Climate Zones must be based on observations – there are no observations of the future.
Thanks for reading.
Share this:

Discover more from Climate- Science.press
Subscribe to get the latest posts sent to your email.
You must be logged in to post a comment.