

From NOT A LOT OF PEOPLE KNOW THAT

https://digital.nmla.metoffice.gov.uk/SO_e109527b-8971-4e30-b420-d486dad326de/
The Met Office would love people to think that there is such a thing as a “normal” British climate; any variation from this norm now can then be labelled as an example of a “changing climate”.
There are averages of course, average temperatures, rainfall and so on. But averages and norms are two different things, the former being merely an arithmetic construct.
A look back at the Met Office archives shows just how variable our weather was 100 years ago. The list below shows the headlines for each monthly weather report, with a bit more detail from those reports in some months.
- January: Mild, with frequent gales
- February: An extremely wet month: the second wettest on record in England: temperatures reached 61F: heavy snowfall
- March : Mild and dry
- April: Cold and wet: severe frosts
- May: Cold and dull
- June: Cool, dull and dry
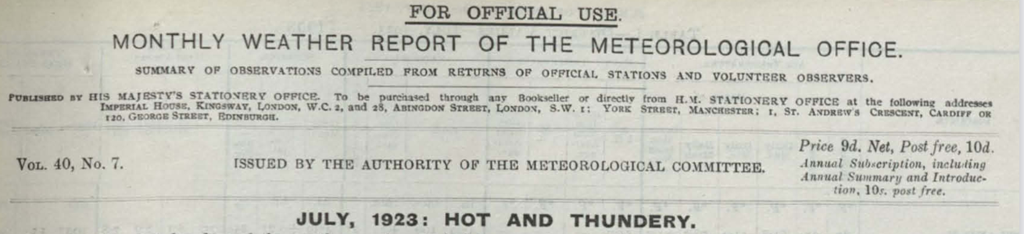
- July: Hot and thundery: temperatures hit 96F: floods caused considerable damage in Cambridge
- August: Rather cool and wet
- September: Cool, sunny in SE, wet in North
- October: Wet and windy
- November: Cold, sunny and foggy: very severe floods in NW England
- December: A variable month: considerable snowfall across Britain
There was nothing unusual about 1923; most years will show similar swings from one extreme to the other from month to month, and week to week.
Share this:

Discover more from Climate- Science.press
Subscribe to get the latest posts sent to your email.
You must be logged in to post a comment.