

From NoTricksZone
By P Gosselin on 31. March 2023

Clouds reduce the energy at the surface, i.e. they currently cool the climate.
The DIY way to demystify „greenhouse gas” claims, Part 6
Are you feeling helpless when trying to assess the veracity of “climate doom is looming” claims we are permanently bombarded with?
Don’t give up trying to understand the relevant basics, there is a rather simple way to get an idea about what this is all about.
Even without a scientific background, most people have at least a good common sense. And that’s all it takes to get a grasp of how energy flows back and forth between earth’s surface and the skies.
By Fred F. Mueller
Preceding chapters see part 1 1), part 2 2), part 3 3), part 4 4), part 5 5)

Fig. 1. An interesting combination of cumulus clouds with white tops and dark underbellies arranged in a nearly linear formation from the background (center right) towards the left side of the picture.
The decisive faulty assumption of current climate science
When discussing climate topics related to the role of the so-called “greenhouse gases” and the distinction the IPCC makes with respect to “forcers” and “feedback amplifiers,” one inevitably stumbles across the question about what is the difference between both. In fact, the molecules from the “nobility” of the greenhouse gases – CO2, N2O and methane complemented by a few minor gases – can pick up very specific types of photons from the infrared spectrum emitted by earth’s surface and re-emit another photon with comparable wavelength some time thereafter. The absorbed photon energy will raise the internal energy of the molecule by initiating mechanical oscillations between its components. Scientist say that such a molecule has been “stimulated”. In this context, it has to be emphasized that under near-surface conditions, a re-emission will take place only for a minuscule fraction of the intercepted photons. Most of the photon energy absorbed by stimulated molecules will simply be converted to kinetic energy due to collisions with the surrounding air molecules, resulting in an insignificant temperature rise of the surrounding air. And only half of the few IR photons that happen to be re-emitted will be oriented downwards to the surface while the other half will follow an upward trajectory. This small fraction of a fraction is alleged to bring down the balance of our climate system. Such allegations simply ignore the fact that our climate system has proven to be resilient against all sorts of catastrophic events including monster volcanic emissions or the impact of the mighty “dino-killer” asteroid some 64 million years ago. But this is not the whole story.
Why is the strongest “greenhouse gas” classified as not being a “real” greenhouse gas?
In an elaborated article, the climate pundits from NASA and NOAA 6) first admit that “water vapor is Earth’s most abundant greenhouse gas. It’s responsible for about half of Earth’s greenhouse effect 7).” Indeed, water vapor interacts with infrared photons in just as as the other “greenhouse gases”. It not only stronger with respect to the bandwidth of IR radiation it is able to intercept but also due to the fact that its abundance in the atmosphere is much higher than that of all the others. Nevertheless, it is dishonourably discharged from their exclusive “greenhouse gas” club because the average residence time of a given water molecule in the atmosphere between evaporation and downpour as rain is only about 8-10 days. That’s the main justification for the claim that increased water vapor “doesn’t cause global warming. Instead, it’s a consequence of it. Increased water vapor in the atmosphere amplifies the warming caused by other greenhouse gases.” While the evaporation of water is driven by temperature, the atmospheric content of the “nobler” greenhouse gases is allegedly being “driven directly by human activities.” Furthermore, they are non-condensing and thus have long residence times ranging from decades to millennia. For this reason, these substances are classified as “forcers” while water vapor (and, together with it, clouds) are designated as simple amplifiers slavishly following the influence of their masters, a view culminating in the subheading: “Carbon dioxide is still king.” This opinion is shared by NASA pundit PhD Andrew Lacis et al 8) who states that: “since CO2 is by far the strongest and most effective of these non-condensing radiative-forcing gases, it follows that CO2 can be identified as the principal LW control knob that governs the global climate of Earth”.
Despite this being a seemingly obvious explanation underscoring the current IPCC narrative, it does not hold water. A river is a mighty phenomenon of its own right, and nobody would deny the might of the Niagara falls with the argument that the individual water molecules forming it will be gone within just a few seconds. Open water, evaporation, water vapor, clouds and rain are just the manifestations of persistent energy streams perceivable as water in various state forms. Although the role of any individual water molecule in it is in fact ephemeral, this stream itself is perpetually kept active by the solar energy the earth constantly receives. And as we have already seen in the previous chapters, it itself – in the form of clouds – plays a decisive role in the control of the amounts of energy reaching the surface of our planet. And that on the other hand is a feat the “official” greenhouse gases are not able to perform. This might be the explanation why the CO2 apologists treat clouds and their effect in the climate process in such an obviously shabby manner.
And worse still for the IPCC narrative, the purported longevity of the “greenhouse gases” is far from being solely dependant on human activity. There are numerous additional factors influencing the fate of these gases apart from the human activities the climate change apologists try so eagerly to put in the spotlight. We will highlight these topics later in this consideration.
NASA’s control system gaffe
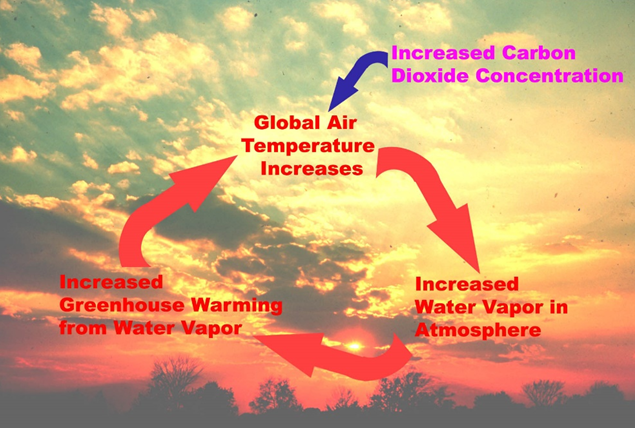
The IPCC, NOAA and NASA all are big, powerful and well-financed organisations that claim to represent the highest level of science when it comes to climate. It is thus all the more astonishing when one looks at how they claim to be educating the public with respect to their narrative of the difference between “real, forcing” greenhouse gases and the “simple, slavishly amplifying” water vapor. Let’s have a closer look at the graphic Fig. 2:

Fig. 2., original caption: “This diagram shows the mechanisms behind a positive water vapor feedback loop. Increases in carbon dioxide, a greenhouse gas, cause a rise global air temperatures. Due to increased evaporation and since warmer air holds more water, water vapor levels in the atmosphere rise, which further increases greenhouse warming. The cycle reinforces itself. The background is a sunset through altocumulus clouds. Credit: NASA and NOAA 9) Historic NWS Collection”
This graphic might be regarded as a striking example for the obvious low esteem our climate pundits have for the recipients of their messages. Even a layman can easily recognize that the loop formed by the three curved red arrows represents a runaway feed back that just has to be triggered once in order to continue indefinitely until the system breaks down or runs out of steam. One can simply reproduce such a phenomenon by connecting a microphone to an amplifier and holding the former next to the loudspeaker: as soon as a critical distance is undershot, the system will start to produce a loud, squealing noise that can only be interrupted by either retracting the mike or by turning back the volume control knob of the amplifier.
The decisive omission is that a system as depicted in Fig. 2. Simply lacks any control handle or knob. If it were true, earth would suffer under conditions resembling those on Venus, with an atmosphere consisting of evaporated oceans, evaporated sulphur dioxide and a minor amount of CO2. Temperatures up there reach a median value of 467 °C. Contrasting with these conditions, earth’s natural processes exhibit a very efficient control system that is self-regulating and has, for more than 3.5 billion years, securely kept our climate system within boundaries supporting life. This is done by cutting back the influx of solar radiation energy as soon as the temperatures rise too much. Keep in mind that a stable climate can only exist if energy input and output is largely balanced, with the main control lever being to cut back the input (= solar radiation) if it is too high. And there’s only one mechanism in the atmosphere’s climate influencing toolbox that’s able to do this job: water vapor. Among the “greenhouse gases,” only water vapor can form clouds that will gradually block solar energy from reaching the surface. If higher temperatures cause more water to evaporate, the skies will fill with more clouds reflecting higher proportions of solar radiation back into space. Neither CO2 nor the other “greenhouse gases” can do this. It’s as simple as that. Let’s just have a look at the relevant figures.
Evolution of the atmospheric CO2 content since 1750
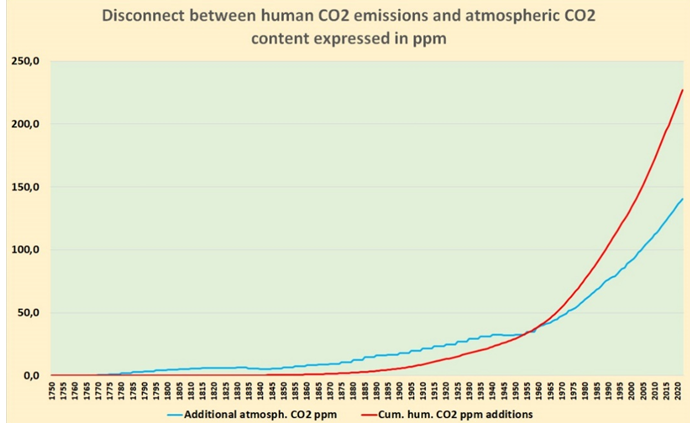
In order to clarify this question, let us first have a look at the development of CO2 levels in the atmosphere since 1750, which has been declared as starting point of human interference in our climate system, see Fig. 3:

Fig. 3. The blue line shows the increase of atmospheric CO2 in ppm since 1750 in comparison to the red line representing the cumulated human CO2 emissions converted to ppm over the same time period. Graphic based on figures from CDIAC 10), EUROPEAN 11), NOAA 12) and IEA 13)
On a side note, looking at Fig. 3., one can immediately see that both diagrams seem to follow comparable characteristics albeit with different parameter sets. Their intersection around the year 1960 marks a clear disconnect since from then on, the absorption of CO2 by sinks such as the ocean and plant growth takes the lead over the role of the atmosphere as dominant buffer for CO2 released by human activity. This fact casts doubts on the validity of the assumption that the oceans won’t be able to take up atmospheric CO2 14) at the same rate as before. And it also collides with claims related to the validity of the much-cited Revelle or buffer 15) factor influencing oceanic CO2 uptake. We will focus on this topic in subsequent chapters of the article.
What dominates cloud effects: warming or cooling?
As we have seen in part 2 and part 3 of this article, clouds have two opposing effects on earth’s energy budget. On the one hand, they reflect incoming solar radiation, thus greatly reducing the solar energy input into the system consisting of the surfaces of land and oceans and the atmosphere.
On the other hand, they can absorb infrared emissions from the surface and partly re-emit it back down, thus significantly slowing the radiative cooling of the earth’s surface. The tricky thing about this is that the same cloud can have a largely different effect – ranging from strong warming or strong cooling – depending on the time of day it passes over a given location. Their function as a sort of lid reflecting incoming solar energy is expressed by their albedo, a figure between 0 and 1 characterizing the proportion of solar shortwave radiation they reverberate back into space, see Fig 4.

Fig 4. The albedo or reflectance of different structures on earth for incoming solar radiation energy (Graphic: Wereon, CC 2.5) 16)
On a planetary scale, clouds, ice and snow are the dominating factors when it comes to determine the proportion of incoming solar energy that will be allowed to reach the surface. Once there, most structures such as soil and especially water will absorb most of it, transforming it into the warmth that is the base for all life on earth.
But without a sufficient planetary albedo, we would really have a sort of global warming threatening life on earth. On large swathes of our surface, temperatures would by far exceed the levels we now have in death valley. In this context, the American Meteorological Society 17) states that “on average, the earth reflects 31 units of solar radiation back to the space for every 100 units received (thus, the total earth albedo is 0.31). The cloud albedo accounts for 23 units of the 31”.
But in addition, one should not forget about the other decisive effect of clouds with respect to livable conditions:
Their warming effect helps in preserving this warmth over sufficient time periods to prevent temperatures chuting too far below freezing levels during night time or in the winter.
In fact, as seen in Part 3 of the article, clouds act as an insulating cover preserving significant proportions of the IR radiation constantly emitted from the surface of soils and oceans from simply disappearing into space. In fact, the majority of what our climate change pundits call the “greenhouse effect” of our atmosphere is in reality secured by two factors the official climate science is disregarding as ephemeral: water vapor and clouds.
Different assessments of cloud effects within the climate science community
In this context, it is interesting to note that – probably due to the fact that our climate scientists are solely focused on CO2 –, there is dissent when it comes to qualifying the overall effect of clouds. Just a few statements, starting with two sources representing the more modelling-oriented approach while the two others are more inclined to focus on measurements:
Science education center of the University Corporation for Atmospheric Research (UCAR) 18): “currently, the combined effect of all clouds is one of net cooling, meaning that clouds are dampening the rate of climate warming……According to model results, clouds will likely amplify climate change in the future. This is called a positive feedback”.
Our warming planet – Andrew Lacis NASA Goddard Institute for Space Studies 19): “as a result, water vapor and clouds can only act to magnify an initial radiative perturbation, but cannot act on their own initiative to manufacture or impose a sustained warming or cooling trend on global climate, even though they may contribute more strongly to the overall atmospheric radiative structure than the radiative-forcing GHGs that actually drive and control the global temperature trend”.
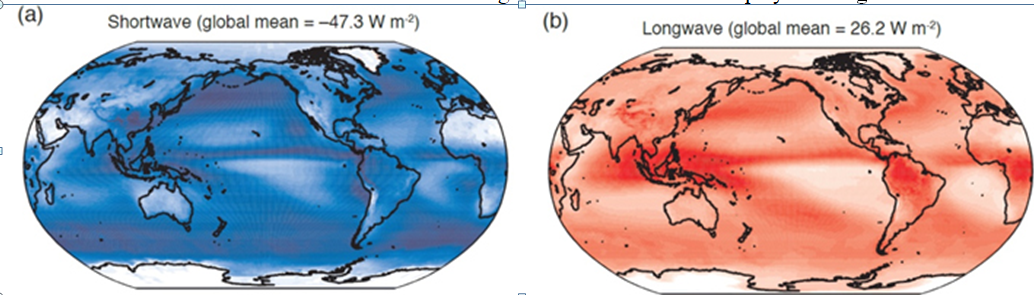
NOAA Geophysical Fluid Dynamics Laboratory 20): “The net global mean CRE (= Cloud Radiative Effect) is approximately -20 W/m2 implying a strong net cooling effect of clouds on the current climate”. The -20 W/m2 are the mean value between the shortwave and the longwave radiation effects displayed in Fig. 5.

Fig. 5. IPCC AR5 report (Chapter 7, Fig.7.7a-b): distribution of annual-mean top of the atmosphere (a) shortwave, (b) longwave cloud radiative effects averaged over the period 2001-2011 from the CERES EBAF (ed2.6) data set. (Graphic: NOAA)
This view is also shared by the German DWD 21): “Clouds have therefore a cooling effect in the shortwave wavelength range and a warming effect in the longwave wavelength range, respectively. The resulting net effect of clouds on the radiative balance is estimated to be around -20W/m-2, averaged over the entire globe. This implies that clouds reduce the energy at the surface, i.e. they currently cool the climate. The radiative effect of the clouds is about four to five times larger than the radiative effect expected from a doubling of CO2concentration”.
In the next part of this series, we will present measured long-term variances of cloud effects underscoring the fact that water vapor and clouds have definitively broken the “simple follower and amplifier of CO2” ideological chains restricting them from being recognized as climate factors of their own right. Stay tuned.
Sources:
1) https://notrickszone.com/cuts-corners/
2) https://notrickszone.com/assumptions/
3) https://notrickszone.com/20greenhouse-gases/
4) https://notrickszone.com/greenhouse-gases/
5) https://notrickszone.com/ipcc-claims/
6) https://climate.nasa.gov/greenhouse-effect/
7) https://climate.nasa.gov/greenhouse-effect/
8) https://www.worldscientific.com/matter
9) https://climate.nasa.gov/effect/
10)https://cdiac.ess-dive.lbl.gov/ems
11) https://www.eea.europa.eu/tab-chart_6
12) https://gml.noaa.gov/ccgg/trends/
13) https://www.iea.org/data2019-2021
14) https://bg.copernicus.org/declines
15) https://agupubs.onlinelibrary.wiley.com/B003407
16) https://commons.wikimedia.org/wiki/File:Albedo-e_hg.svg
17) https://glossary.ametsoc.org/wiki/Cloud_albedo
18) https://scied.ucar.edu/water-cycle-climate-change
19) https://worldscientific.com/worldscibooks/10.1142/12312
20)https://www.gfdl.noaa.gov/cloud-radiative-effect/
21) https://www.dwd.de/EN/.html

You must be logged in to post a comment.