It’s just another day in the hottest ever hyperbole race. The most unprecedentedly unprecedented record where more scientists on Earth than ever before, forget more of the Pleistocene than they ever have in history.
This year didn’t just shatter records. It changed the scales.
Graph after graph tracking this year’s soaring global temperatures reveal that not only were the numbers higher than ever recorded in many places around the world, but the deviation from the norm was also astonishingly large.
Michael Mann says it’s the fastest rate of warming for millions of years. Naturally, no science journalist thinks to ask him how he could possibly know this?
What’s especially concerning, experts say, is that “the rate of warming over the past century has no precedent as far back as we are able to look, not only hundreds or thousands, but many millions of years,” according to University of Pennsylvania meteorologist Michael Mann’s book “Our Fragile Moment.”
Think about how impossibly hard it is to know how much the world warmed from say 3,450,000 BC to 3,449,900? I mean in the last 10 million years there are 100,000 whole centuries. How many samples do we need each century from around the world to estimate what the “global” rate of warming was in every single century? If we just have three samples from the year 2 million BC, could we really say we knew what the temperature was?
Here (below) is one estimate of temperatures for the last 50,000 centuries. It’s a wild ride. Really, truly, could anyone say there wasn’t one century that warmed faster than our last one?
Graph based on work by Lisiecki and Raymo in 2005. Image created by Robert A. Rohde / Global Warming Art
Has Michael Mann found an unknown trove of temperature records from Australopithecus onward, or was it just a moment of mad arrogance fueled by 30 years of propaganda?
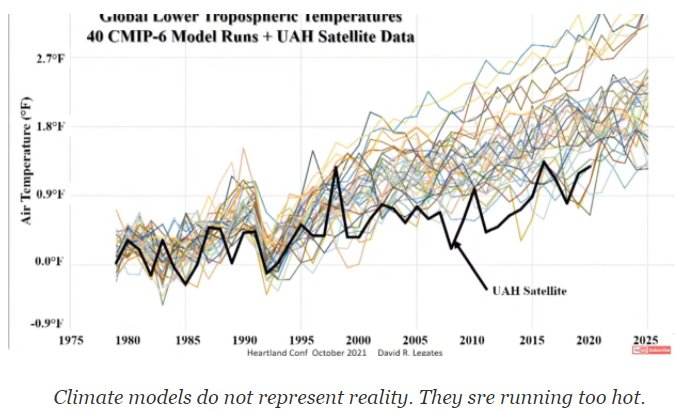
Most climate models are worse than garbage, a number of real measurements, peer-reviewed studies and data show. Their phony results are mainly used to spread fear.
Models put out hyper-exaggerated fiction. Image: PIK.
The outputs of model simulations often get confused by the media and public as real measurement results. But often they are generated nefariously to promote panic.
Recall the pandemic models showing showing 100s of millions would die if we didn’t lockdown. In reality COVID 19 was no worse than a regular flu.
What follows are 61 NTZ posts from 2023 that show that climate model results have nothing to do with reality. Their outputs are garbage.
1. Typhoons are supposed to be getting more frequent and worse. They are not.
2. Sea levels rise is accelerating, models say. Fact: at many places they are falling.
3. It’s the hottest in 125,000 years. Wrong, e.g. it was fore example 4-7°C warmer in Austria 2000 years ago.
46. Again another study telling us CO2 isn’t the driver, “only affects a small range of long-wave re-radiation from the surface of the Earth,”… “seems to be no connection between carbon dioxide and the temperature of the Earth.” − Harris, 2023
48. German agrarheute.com asks whether the climate models are wrong since “East Pacific has been cooling down more and more over the past 30 years” and this “contrary to all predictions”.
49. The models refuse to acknowledge the sun, even though the data is glaring. “Solar forcing may have a 4 to 7 times greater effect on climate change than current climate models indicate.”
50. The Arctic has stopped losing sea ice and been steady over the past 15 years, unlike what the models had told. And take a look at these wild “model-based” predictions of the past:
53. Two Portuguese scientists (Khmelinskii and Woodcock, 2023) identify at least 8 assumptions in the “greenhouse gas hypothesis” that lack scientific validation. Models can’t work if the assumptions are grossly false.
You’d have to be a real sucker or a journalist to believe any climate model output. They are nowhere near simulating anything that is remotely close to reality.
Heartland Institute Board Member Steve Milloy — founder of E&E Legal and Junkscience.com — was on Dagen & Duffy on the Fox Business Channel this week debunking the myth that July was the hottest month in human existence, and make the point that carbon dioxide is NOT driving warming global temperatures at all.
As Miilloy points out: “Over the last eight years there has been no warming despite 500 billion tons of emissions. How can that possibly be?”
Milloy also shares the outrage of the hosts that our children are being indoctrinated about climate, not taught about it, and it is causing a growing mental health crisis — and not just among kids.
It seems like yet another climate doomsday prediction has failed to materialize.
In August of 2005, the ever-alarmed Guardian posted this scare story:
Warming hits ‘tipping point’
Siberia feels the heat It’s a frozen peat bog the size of France and Germany combined, contains billions of tonnes of greenhouse gas and, for the first time since the ice age, it is melting. … “If we don’t take action very soon, we could unleash runaway global warming that will be beyond our control and it will lead to social, economic and environmental devastation worldwide,” he said. “There’s still time to take action, but not much.
The article continues with:
Researchers who have recently returned from the region found that an area of permafrost spanning a million square kilometres – the size of France and Germany combined – has started to melt for the first time since it formed 11,000 years ago at the end of the last ice age.
…
It is a scenario climate scientists have feared since first identifying “tipping points” – delicate thresholds where a slight rise in the Earth’s temperature can cause a dramatic change in the environment that itself triggers a far greater increase in global temperatures.
…
The discovery was made by Sergei Kirpotin at Tomsk State University in western Siberia and Judith Marquand at Oxford University and is reported in New Scientist today.
The researchers found that what was until recently a barren expanse of frozen peat is turning into a broken landscape of mud and lakes, some more than a kilometre across.
Dr Kirpotin told the magazine the situation was an “ecological landslide that is probably irreversible and is undoubtedly connected to climatic warming”. He added that the thaw had probably begun in the past three or four years.
Climate scientists yesterday reacted with alarm to the finding, and warned that predictions of future global temperatures would have to be revised upwards.
“When you start messing around with these natural systems, you can end up in situations where it’s unstoppable. There are no brakes you can apply,” said David Viner, a senior scientist at the Climatic Research Unit at the University of East Anglia.
Three things in the article are important to note:
As indicated by this PowerPoint presentation, the researcher Kirpotin visited in the summer, not the winter We have no weather records back to 11,000 years ago, we don’t know if such an event occurred in the summers of past millennia. But, it is reasonable to assume that given the propensity for that region to have large temperature swings, some melting in the summer is regular event every few years or decades. From Wikipedia, bold mine:
Verkhoyansk, a town further north and further inland, recorded a temperature of −69.8 °C (−93.6 °F) for three consecutive nights: 5, 6 and 7 February 1933. Each town is alternately considered the Northern Hemisphere’s Pole of Cold – the coldest inhabited point in the Northern hemisphere. Each town also frequently reaches 30 °C (86 °F) in the summer, giving them, and much of the rest of Russian Siberia, the world’s greatest temperature variation between summer’s highs and winter’s lows, often well over 94–100+ °C (169–180+ °F) between the seasons.
They say “…the thaw had probably begun in the past three or four years.” This indicates they don’t actually know, but are speculating. Speculation is not science, it is opinion. Further, three or four years is not long enough to establish any sort or climate pattern, which is defined by the World Meteorological Organization as being 30 years:
Climate is the average weather conditions for a particular location over a long period of time, ranging from months to thousands or millions of years. WMO uses a 30-year period to determine the average climate.
If we believe The Guardian story and those climate scientists in 2005, the whole area in Siberia must be a warm soupy mess by now, right?
Wrong.
That extended warming and melting just isn’t happening. While the researchers sounded alarm over a warm summer in Siberia in 2005, this past year has been completely the opposite. For example, this Washington Post Story from Jan 10, 2023: Siberia sees coldest air in two decades as temperature dips to minus-80
It must be tough to keep that permafrost at a melting tipping point with winter temperatures like that. Here is the view of the region today, note the widespread below zero temperatures:
You can be certain that any permafrost that “melted” during the summer is now refrozen and the tipping point aka “methane monster” is still in slumber.
Permafrost peatlands approach a climate tipping point Permafrost peatlands in Europe and Western Siberia are much closer to a climatic tipping point than previously thought, according to a new study led by the University of Leeds. Scientists estimate that, even with the strongest efforts to reduce greenhouse emissions and therefore limit climate change, by 2040 the climates of Northern Europe will no longer be cold and dry enough to sustain peat permafrost.
If I’m still alive in 2040, I’ll write about it then. But my guess (or speculation if you like) based on the history so far is that the permafrost will still be there in Siberia, no catastrophic tipping point will have occurred, and the doomsday goalposts will have been pushed to 2060 and beyond.
The benefits of not meeting Paris Accord emissions-reduction targets outweigh the costs associated even with worst-case-scenario global warming throughout the 21st century.
A new comprehensive analysis (Tol, 2023) weighs the cost-benefit of meeting Paris Accord emission policy targets to keep global warming in check, or under 2°C.
The analysis reveals that even in the best case scenarios (that assume emission reduction policies fully meet their avoided-warming targets), as well as in the worst case scenarios (that assume “constant vulnerability” to global-warming-induced climate disasters and widespread economic austerity), the tens of trillions of USD costs associated with moving away from fossil fuel consumption to reach net-zero emissions by 2050 (4.8% of GDP) still outweigh the net benefit losses (3.0% of GDP) in 2100.
“The central estimate of the costs of climate policy, unrealistically assuming least-cost implementation, is 3.8–5.6% of GDP in 2100. The central estimate of the benefits of climate policy, unrealistically assuming high no-policy emissions and constant vulnerability, is 2.8–3.2% of GDP.”
There is a nearly 10 times worse cost versus benefit if we only consider the net impact of best- and worst-case-scenario emissions reduction policies through 2050, which is the year it is assumed the world economy will have reached net-zero targets if all goes according to plan.
“In 2050, the year of net-zero, the best estimate of the benefits of the 1.5∘C target are about 0.5% of GDP while the costs are almost 5%.”
Of course, if the more realistic outcomes with regard to achieving emissions reduction targets eventuate, and if the global warming on tap for failing to achieve these targets is not as exaggeratedly hot as models assume (e.g., 5°C warming by 2100), the net costs of climate “action” exceed the benefits of avoided warming two-, three- and even four-fold.
Simply put, the “Paris targets do not pass the cost-benefit test.”
When I first started studying ecology, the island of Surtsey off the southern coast of Iceland was quite inspirational.
Surtsey rocked up out of the sea in November 1963, and instantly became a mine of ecological data.
Here comes the science part [elementary ecology]:
In ecology, groups of species living in the same place at the same time are called communities. Communities change over time, even if there is no external influence. Eventually, in the absence of external influences, the community in question will converge on something called a climax community, which means that in the absence of external influences, no new changes will occur. Lots may be happening, but nothing changes. In practice this means a succession of species over time, from opportunistic types to more competitive types. If you abandoned London right now, the bare concrete would eventually end up becoming oak/ash woodland, which would be permanent until a new ice age or maybe catastrophic global warming.
I used the word succession there, and in ecology there are considered to be two types: primary and secondary. Secondary succession is like abandoning London. There are already plenty of trees around and plenty of other plants growing in gardens which would form the basis of the first ecological communities after the capital’s abandonment.
The other kind is primary succession, and for that, you need a completely blank slate. You need to start with nothing. Succession still occurs but every part of the community has to find its way in from outside. Such situations are quite rare in the real world.
[End of elementary ecology lesson.]
So, this is where Surtsey is so important, and so inspirational. Ecologists generally have an idea about how primary succession might go, without being able to observe it happening. But as soon as Surtsey began to cool enough for something to survive on it, primary succession began. We had a sterile surface, an island, onto which new life could only arrive by sea or by air.
Since its birth 60 years ago, plenty of ecologists have devoted a lot of time to the study of Surtsey. It has its own research society. Visitors are few, and they have to ensure that they do not accidentally contaminate the island with a new species. [According to Wiki, the first visitors were French journalists, who landed on the island almost exactly 60 years ago (6th December, 1963). They claimed it for France as a bit of a laugh.]
Interestingly most of the early species to arrive on Surtsey would have been familiar to any British ecologist as plants of the strandline – the difference in climate not seemingly too relevant. Later arrivals were potatoes – planted by some boys as a jolly jape and dug up by indignant scientists – and a tomato plant (again via Wiki):
An improperly managed human defecation resulted in a tomato plant taking root, which was also destroyed.
I don’t think they needed to bother there. I can’t ripen tomatoes in my back garden reliably. They ain’t gonna ripen on Surtsey. But the presence of a tomato plant is a useful indicator of a sewage spill on British beaches: worth taking note of when you see toddlers playing in that little stream of water coming out of the storm drain.
The Iceland Met Office has a webcam on Surtsey (available via the Research Society link). This is what it looked like at 3 minutes to four yesterday:
Surtsey is legendary in ecological circles. So it should not be too surprising to learn that this student of ecology was interested to read the news that a new island had breached the ocean’s surface near Japan. Here is a headline from the Japan News on November 10th:
New Island Created near Iwoto Island from Undersea Volcanic Eruption, Japan Meteorological Agency Says; May Disappear as Eruption Dies Down
It would be rather disappointing if the new island disappeared as soon as the eruption finishes. Why might that be? [Caveat: I know nothing about geology. I am prepared to be corrected if I abuse the nomenclature.] Well, when the molten rock hits the ocean water it is immediately quenched and turns to what is basically glass. But this material is not consolidated. It’s in bits. They call it tephra, which comes from the Greek for ash, and it is easily washed away.
But Surtsey is still there after 60 years. What gives? Well, if the eruption reaches the surface, the lava will not be instantly quenched, and may set as fairly sturdy lava flows. The tephra, given time and hot water, can become glued together to form tuff – which is rather more resistant to erosion.[Not very tough. Not granite. In fact it’s soft.] Surtsey has in fact shrunk markedly over the decades, but it is thought that its solid core of tuff will remain resistant to the briny for another thousand years or so. [Other islands in the Westman Isles are of similar or greater antiquity, and have become reduced to stack-like kernels of their former selves.]
After that very superficial overview, I wanted to mention that I had no idea where the island of Iwoto mentioned in the Japan News story was. The BBC covered the story and left me no less confused:
An explosive eruption last week sent volcanic rock hurtling into the sea around Niijima Island, located 970 km (600 miles) from the Japanese capital Tokyo.
Now, I admit to misreading this the first time, and to thinking that Iwoto and Niijima referred to the same island. But they don’t. The BBC was helpful in translating the meaning of the word Niijima as “New Island.” They also said it appeared ten years ago, but that is wrong. Maybe it’s a mistranslation.
The volcanic island was formed 10 years ago. Its name translates as “new island”.
Astute readers, even those with no passing acquaintance with Japanese, might have recognised parts of those two names. [My only knowledge of Japanese comes from watching large amounts of anime, with subtitles on and original voices, but sadly I am not learning much. I recognised parts of the names and merely thought them commonplace nouns that often form compound names. However, looking up Iwoto, I found that it is actually the island formerly known as Iwo Jima.
Everyone has heard of Iwo Jima – I’m sure every Cliscep reader has, at any rate – thanks to the events of February 1945, when the U.S. Marines stormed the beaches of the tiny island. Brutal is not a sufficient adjective for the ensuing fighting. What I was not aware of, or had forgotten, was what happened on Iwo Jima in 1985, 40 years later.
Veterans of both sides, and widows of the Japanese defenders, met on the island to commemorate the anniversary of the battle. Former bitter enemies shook hands and hugged. A monument was unveiled, inscribed in Japanese on the landward side, and English on the seaward side, representing the direction in which the fighting occurred. [This according to Wiki; they might in fact be separate monuments on the same site, and may pre-date the 40th anniversary.]
You can see part of the commemoration here, at the end of this contemporary documentary. [Should take you to the right moment.]
What this rabbit hole reminded me is that there are two kinds of war. The kind that ends, and the kind that never ends. Thankfully the war in which Iwo Jima featured was one of the former.
COP28 President and Chief Executive of the UAE state oil company Adnoc, Sultan Ahmed Al-Jaber let the cat out of the bag this week when he said there was “no science” that says phasing out fossil fuels will achieve a cap on global warming of 1.5°C.
In an interview with the impressively self-important Irish politician Mary Robinson, he demanded to be shown a roadmap for sustainable socioeconomic development “unless you want to take the world back to caves”. You would have had a heart of stone not to enjoy the antics of the BBC green activist-in-chief Justin Rowlatt as he tried to finesse Al-Jaber’s remarks. What a creative chap to write a BBC story about it headed, ‘Is the world about to promise to ditch fossil fuels?‘
Rowlatt claims that the UAE has recognised the world has to kick its addiction to unabated fossil fuels and has decided to put itself decisively on the right side of history by trying to own the decision. “But yes, at the same time it is planning to increase capacity and sell even more oil,” he helpfully added.
Other more realistic interpretations are available. The world will need as much, if not more, fossil fuel in 2050 as it consumes today, and its biggest customers will be those who are too virtuous to drill and frack the hydrocarbons for themselves. As is usually the case, the meek are unlikely to inherit the Earth.
Al-Jaber might have slightly underestimated the type of housing stock available in future ‘Net Zero’ countries – mud and grass huts are suggested in a recent United Nations report, although sustainable caves could occupy a premium niche. With money comes power and all the trophy assets vast wealth can buy.
For instance, by 2050 the Gulf Arabs, along with Saudi Arabia, will be able to buy all the football clubs they want. In the end it might just be easier to relocate the entire English Premier League into state-of-the art, air conditioned local stadiums.
Al-Jaber’s remarks blew holes in a ‘settled’ science narrative that has been carefully curated over decades by collectivists aiming to transform global societies with a Net Zero project.
A bewildered John Kerry, the U.S. presidential climate envoy, suggested the comments may need “clarification” and “maybe just came out wrong”. Kerry’s irritation showed clearly that Al-Jaber had undermined the fixed idea that reducing human-caused carbon dioxide will somehow stop temperature moving around in a chaotic atmosphere.
Despite 50 years of trying, scientists have yet to produce conclusive proof that humans control the climate thermostat. A rival hypothesis that trace gases such as CO2 ‘saturate’ past certain levels and lose much of their warming abilities has the advantage of offering an explanation for the absence of an obvious temperature-CO2 link over the last 600 million years.
For alarmists, Al-Jaber’s linking of his remarks with the 1.5°C limit was very unfortunate. The idea that humans need to cap a rise in global temperature to 1.5°C is an invented number designed to invoke panic and concentrate the political mind. The setting of an arbitrary target is credited to IPCC lead author and former climate adviser to Angela Merkel, Hans Joachim Schellnhuber. At first he set the limit at 2°C, and in 2010 he was asked by Der Speigel why he had imposed the “magical limit” to which all countries must adhere. In reply, Schellnhuber said: “Politicians like to have clear targets and a simple number is easier to handle.” The ploy was so successful that it was ratcheted down to a scarier 1.5°C to persuade politicians to sign the Paris climate agreement in 2015.
Again, none of this is based on science. The rise of 1.1°C since the lifting of the Little Ice Age is tiny in climatic terms and to be expected after hundreds of years of slowly declining temperatures. In the cyclical historical record of the last few thousand years, temperatures were similar in Medieval and Roman times, while observational evidence from the mid Holocene suggests large rises of around 3-4°C.
Rowlatt’s copy is of interest since it hints at the dawning realisation that a world without the power provided by hydrocarbons is impossible to achieve. He quotes the new head of the Intergovernmental Panel on Climate Change, Professor Jim Skea who explains that stopping the temperature rise will mean getting rid of unabated coal completely. But, in Skea’s view, the world of Net Zero will still need 40% and 55% of its current oil and gas supplies respectively. Rowlatt picks up on the word ‘abated’, noting that the technology to do that “does not exist at anywhere near the scale needed”. This is the guiding “science” that Al-Jaber is talking about, concludes Rowlatt, at a time when the Gulf States sell huge quantities of oil and gas to power-starved Western countries leading the way to Net Zero.
For some inexplicable reason, Rowlatt fails to channel similar understanding when campaigning to ban fossil fuel exploration in the U.K. And to think of all the jobs and wealth that might have been created if frackers had got on with fracking, while an understanding press praised their scientific credentials and were happy to waffle on about unworkable abatement technologies.
Chris Morrison is the Daily Sceptic’sEnvironment Editor.
X-account Kunstliche Intelligenz here reports on Germany’s recent heavy snowfalls in Munich, which surprised experts and media and sent them scrambling for an explanation.
Chart shows the max. snow depth reached and date occurred each year in Munich since 1954. Source: Kunstliche Intelligenz
It’s snowing a lot in Germany and climate researchers already feel compelled to modify their explanations in an effort to maintain interpretative sovereignty. A brief summary of the contradictions that are becoming apparent.
1. Polar vortex: cooling leads to more snow 2021 already saw a lot of snow in Europe. Climate researchers argued it was snowing more because it was getting colder in northern Europe despite global warming. The behavior of the polar vortex was cited as the cause (strong/weak polar vortex and jet stream). [1]
Evidence: climate change leads to less snow However, the amount of snow is actually decreasing in Europe due to climate change, as satellite analyses show. From 1973/74 to 2022/23, the amount of snow fell continuously by a total of 20.4%. [3]
2. Humidity: warming leads to more snow In 2023, there will again be a lot of snow in Germany. Another explanation is making rounds: due to climate change, the temperature is rising, the atmosphere is absorbing more moisture and as a result it is also snowing more, albeit at higher temperatures. [2]
Evidence: New snow records in Germany (See chart) The evaluation of historically measured maximum snowfall amounts shows that the snowfall in Munich on December 2 is an all-time December record with 44 cm. [4] If you analyze the data, you can see that the maximum snowfall from 1954-1974 was particularly high with an average of 25 cm. This fits in with the drop in temperatures between 1940 and 1975, which gave rise to speculation that a new ice age was imminent. [5] Since 1975, on the other hand, the maximum amount of snow has averaged 19 cm with no clear trend.
Conclusion: Depending on the evaluation and explanation, you can interpret anyything into the snow data and argue for or against global warming. But if you realize that weather and climate are chaotic systems that are fundamentally unpredictable and that the assumption of a monocausal relationship that is supposed to dominate everything (CO2 concentration and temperature) is ultimately just a model assumption and nothing more, the cognitive dissonance immediately fizzles out. Like all other weather phenomena, the amount of snow in 2024 will not take into account any extremely simplified and under-complex computer modeling, but will surprise us again and again.
“Working in global energy and development, I often hear people say, ‘Because of climate, we just can’t afford for everyone to live our lifestyles.’ That viewpoint is worse than patronizing. It’s a form of racism, and it’s creating a two-tier global energy system, with energy abundance for the rich and tiny solar lamps for Africans.” – Kenyan activist and materials scientist Rose Mutiso
“To deny the developing world access to the very infrastructure that has propelled us forward, all in the name of an uncertain future, is not environmentalism, but neocolonialism masquerading as virtue.” – Earth Scientist Matthew Wielicki
100 years ago, the global population was 2 billion. Over the past century, the population has increased to 8 billion, life expectancy has more than doubled, a much smaller percent of the global population is living in poverty, global wealth has increased by a factor of 20, agricultural productivity and yields have increased substantially, and a far smaller fraction of the population die from extreme weather and climate events. Hannah Ritchie’s ourworldindata.org provides fascinating data on global progress.
And all this has occurred during a period where the global temperatures have increased by about 1oC. The UN has dropped the extreme emissions scenarios (RCP8.5 and SSP5-8.5) from use in policy making, and the UNFCCC COP27 worked from an estimated 2100 warming of 2.5ºC.[1] The 2023 IEA Roadmap to NetZero Stated Policies Scenario (STEPS) projects a rise in average global temperature of 2.4ºC by 2100.[2] When plausible scenarios of natural climate variability and values of climate sensitivity on the lower end of the IPCC range are accounted for, the expected warming could be significantly lower.
So our current best estimates of global warming by 2100 indicate that we will likely be close to, or within, the 2ºC target by 2100, based on our current understanding. So we are looking at an additional 0.8 to 1.2oC warming over the remainder of the 21st century, according to our current understanding. Natural climate variability is of course a wild card that can cut both ways, but the portion of the 21st century warming that the UN is hoping to control is order of 1oC.
The world has already shown that it can thrive under a warming rate of 1oC/century. To support continued human development and progress in the 21st century, there is widespread international agreement on the UNSDG Sustainable Development Goals, which provides a ranked list of 17 goals.[3] The goals related to climate and energy policy include (with numerical ranking):
No poverty
No hunger
Affordable and clean energy
Industry, innovation and infrastructure
Climate action
There is growing recognition that climate change is as much a development problem as it is an environmental one. Development deals with the alleviation (or eradication) of poverty. More recent notions of development include sustainable development and climate resilient development, which emphasize economic development without depletion of natural resources.
Tensions arise when the “sustainable” part—which includes no new fossil fuel-based energy systems—conflicts with poverty eradication and other sustainable development goals.
Inconsistency of Net Zero by 2050 with UN Sustainable Development Goals
A recent UN Report on Progress Towards Sustainable Development Goals states:[4]
“Under current trends, 575 million people will still be living in extreme poverty in 2030, and only about one third of countries will meet the target to halve national poverty levels.”
“Shockingly, the world is back at hunger levels not seen since 2005, and food prices remain higher in more countries than in the period 2015–2019.”
“At the current rate of progress, renewable energy sources will continue to account for a mere fraction of our energy supplies in 2030, some 660 million people will remain without electricity, and close to 2 billion people will continue to rely on polluting fuels and technologies for cooking.”
Neglecting these sustainability objectives in favor of rapidly reducing CO2 emissions is slowing down or even countering progress on the most important Sustainable Development Goals.
Efforts to rapidly restrict the use of fossil fuels is hampering the #1 goal of poverty reduction in Africa and is restricting Africa’s efforts to develop and utilize its own oil and gas resources (goal #7), as funds previously used for development are being redirected to CO2 mitigation (goal #13).[5]
The #2 goal of no hunger is being hampered by food prices and availability are being worsened by climate mitigation efforts (goal #13), such as disincentives for fossil fuel development causing less supply and higher prices of fuels necessary for agriculture, biofuels (e.g. corn and seed oils), restrictions on livestock, and restrictions on fertilizer.
Industry and infrastructure (goal #8) require steel and cement, which are currently produced by fossil fuels. Until such a time when steel and cement can be produced economically without fossil fuels, restricting fossil fuel access particularly in developing countries to support CO2 mitigation targets (goal #13) is hampering the development of industry and infrastructure, including clean energy projects.
Should one element of Goal 13, related to net-zero emissions, trump the higher priority goals of poverty and hunger and the availability of energy? Not if human well-being, flourishing and thriving are the objectives. Climate policy driven by the perceived urgency of eliminating fossil fuels and without regard to other needs and trade-offs is itself dangerous.
Conflict between NETZERO, Development and Adaptation
There’s no such thing as a low energy, rich country.
Economic development and resilience in underdeveloped countries are being slowed down by a growing emphasis on linking international development funds to reducing emissions. This emphasis comes at the expense of development funds that have historically been targeted for poverty reduction.
Resilience to weather and climate extremes requires adaptive capacity. The UN Sendai Framework on Disaster Risk Reduction 2015–2030 focuses on the adoption of measures that address all dimensions of disaster risk—hazard, exposure, vulnerability and coping capacity.[1] The Sendai Framework includes seven targets intended to define and measure progress towards its overall goal to increase resilience by reducing risk. The first four targets are to substantially reduce disaster impacts: mortality, number of people affected, economic loss, and damage to critical infrastructure and disruption of basic services. The other three targets are to substantially increase the adoption of national and local disaster risk reduction strategies, international cooperation to developing countries and access to multi-hazard early warning systems.[2]
Now, more than halfway through the period for the Sendai Framework (2015–30), none of the Sendai Framework’s “substantially reduce” targets are on track to be achieved by 2030. Instead, direct economic loss and damage to critical infrastructure having increased substantially over the past decade. Adoption of multi-hazard early warning systems have been the most successful element of the Framework, although these efforts need to be scaled up and made more effective. While disaster-related financing has increased since 2010, most of the resources have supported activities to respond to and recover from disasters.[3]
Simply put, people are considerably less exposed to weather and climate shocks if they aren’t poor. Creating more resiliency in poor countries will require energy-intensive investments in housing, transportation infrastructure, and agricultural technology. Economic development requires the availability of cheap, reliable, and abundant energy.[4]
The World Bank and other development banks provide loans and grants for development projects, and the International Monetary Fund (IMF) helps poor countries overcome currency crises and keep their finances stable. However, these institutions are under pressure from their donor governments to focus on climate change—specifically, to reduce emissions.[5] The IMF recently proposed the creation of a US$50 billion Resilience and Sustainability Trust to help countries tackle climate change, where support would be contingent on recipient countries’ plans to reduce emissions.[6] Similarly, the World Bank has unveiled a climate action plan promising to align all future projects with the Paris Agreement to slash emissions.[7]
As a result, international funds for development are being redirected away from reducing poverty and increasing resilience, and towards reducing carbon emissions. By limiting development of electric power, this redirection is exacerbating the harms from weather hazards and climate change for the world’s poor. Development and poverty reduction require abundant and cheap energy, and natural gas is regarded as the best near-term solution for most countries. Working against this need in developing countries, UN Secretary-General António Guterres has called on countries to end all new fossil fuel exploration and production. The United Kingdom, the United States, and the European Union are aggressively limiting fossil fuel investments; the World Bank, the International Monetary Fund and other development banks are being pressured to do the same. The African Development Bank is increasingly unable to support large natural gas projects in the face of European shareholder pressure.[8]
Limiting the development of fossil fuel projects is profoundly hampering development in Africa. Africa is starved for energy; sub-Saharan Africa’s one billion people have the power generation capacity that is less than the United Kingdom with 67 million people. Natural gas is needed not only for power, but also for industry and fertilizer and for cleaner cooking to avoid loss of life from indoor air pollution. One cannot overemphasize the significance of natural gas as a transition fuel in developing countries, especially in Africa. The irony is that even tripling energy use and emissions in sub-Saharan Africa driven by natural gas would add a meager 0.6 % to overall global emissions.[9] The IEA projects that Africa won’t exceed 4 percent of global CO2 emissions by 2050 regardless of energy scenario.[10]
Leaders from developing countries have been outspoken in criticizing these changes in international funding practices. Ugandan President Yoweri Museveni warns that by pushing climate mitigation on African countries, the West will “forestall Africa’s attempts to rise out of poverty.”[11] A widely viewed Technology, Entertainment, Design (TED) Talk by Kenyan energy expert Rose Mutiso characterized forcing emissions mitigation on the world’s poor that is widening economic inequality as equivalent to “energy apartheid.”[12]
Africa’s fragile progress in recent decades could be undone by international efforts to curb investments in all fossil fuels. However, these same countries that are working to restrict fossil fuel investments in Africa include natural gas in their own multidecade plans to transition to clean energy. The greatest hypocrisy is that some of the largest private European and US firms are developing natural gas in Ghana, Mozambique, Nigeria, and Senegal to export to Asia and Europe, since it can’t be used in the countries of origin for lack of infrastructure.[13]
Prioritizing SDGs over Net-Zero
Every dollar spent on reducing carbon emissions can have a significantly greater impact if directed into education, medical services, food security, and critical infrastructure. To promote human well-being and thrivability, climate action in the poorest countries should concentrate on reducing poverty, increasing energy access, and building resilience via investments in housing, transportation, infrastructure, and agricultural technology.[14]
Wise climate policy needs to recognize that there are no climate “cliff-edges” in the climate system, that there is a plurality of values at play, and that a plurality of goals should be accommodated in policy-making. In this spirit, climate scientist Mike Hulme has called for “climate pragmatism,” which would prioritize SDGs over Net-Zero. This approach “would not necessarily deliver the objective of the Paris Agreement: stabilizing global temperature at between 1.5C and 2C.” Recognizing that trade-offs between different SDGs and between SDGs and stabilizing global temperature are unavoidable, Hulme posits that “[i]t is quite easy to imagine future worlds in which global temperature exceeds 2C of warming which are ‘better’ for human well-being, political stability and ecological integrity, for example, than other worlds in which – by all means and at all costs – global temperature was stabilized at 1.5C.” In relation to the tension between zero-carbon and the need for affordable energy, Hulme states:
“Several of the SDGs – for example, eradicating poverty (SDG#1), securing quality education (SDG#4), ensuring decent work and economic growth (SDG#8) – will require the expansion of affordable and reliable energy services for billions of people, not least in Africa and South Asia. Only some of these services can be delivered by zero-carbon energy.”[6]
How to respond to so-called the climate “crisis” in the midst of genuine crises associated with food and energy shortages and the humanitarian crisis in Ukraine is best reflected by the response of the New Zealand government. In defending its decision to issue fossil fuel prospecting permits in spite of declaring a climate emergency, the New Zealand government stated that the climate crisis was “insufficient” to halt oil and gas exploration.[15] Climate change is indeed a crisis of insufficient weight that will be increasingly ignored by many countries as they grapple with the basic human needs for energy and food.
There is no human right to a safe or stable climate
The UN Human Rights Committee (UNHRC) has stated that:[7]
“… environmental degradation, climate change and unsustainable development constitute some of the most pressing and serious threats to the ability of present and future generations to enjoy the right to life.”
Reference is further given to a 2019 Report written by the UN Special Rapporteur on Human Rights, which concluded the following:[8]
“There is now global agreement that human rights norms apply to the full spectrum of environmental issues, including climate change.”
No attempt has been made by the UN to create international support for a new human right to be protected from climate change. Such a right is neither implicit or explicit in the UNFCCC Paris Agreement.
Even if Net Zero objectives were achieved globally by 2050, the climate would continue to change from natural weather and climate variability: volcanic eruptions, solar effects, large-scale oscillations of ocean circulations, and other geologic processes. Further, given the inertia in the climate system (particularly oceans and ice sheets), it would be many decades before there was any noticeable change in extreme weather/climate events and sea level rise after Net Zero was achieved.
Exaggeration of the risks from human-caused climate change leads to serious contradictions in context of beliefs that human rights offer protection against the impacts of dangerous climate change. Specifically with regards to the right to life, global mortality (per 100,000 people) from extreme weather and climate events have declined by 99% since 1920.[9] Between the period 1980 and 2016, global mortality (per 100,000 people) from extreme weather and climate events has dropped by 6.5 times.[10] For the mortality statistics since 1980, there is a clear negative relation between vulnerability and wealth.[11] Thus, an increase in wealth provides much greater and much more certain protection against climate-related risks than emissions reduction.
The trend in mortality statistics does not mean that weather and climate disasters have become less frequent or less intense. The trend implies that the world is now much better at preventing deaths from extreme weather and climate events than in the past. This has been accomplished through increasing wealth, which provides better infrastructure, greater reserves, advance warnings, and greater recovery capacity.
Towards an Energy Transition that Supports Sustainable Development Goals
Yes, we can seek to lower emissions as low as reasonably practical, ideally while minimizing our regrets and maximizing our opportunities through the energy transition. But we should not pretend that we are controlling the climate. And people are less inclined to act on the energy transition if they can’t imagine the endpoint, and can’t see themselves better off in the future.
The IEA Net Zero Roadmap makes a fundamentally important statement about the transition to Net Zero. Clean energy investment and demand reductions will drive the energy transition, not a premature removal of fossil fuel resources:
“A large and sustained surge in clean energy investment is what removes the need for new fossil fuel projects in the NZE Scenario: reducing fossil fuel supply investment in advance of, or instead of, policy action and investment to reduce demand would not lead to the same outcomes. Prolonged high prices would result if the decline in fossil fuel investment in this scenario were to precede the expansion of clean energy and the action to cut overall energy demand that are also set out in this scenario. This would reduce the chances of an orderly transition to net zero emissions by 2050 and underlines the importance of action to secure the kind of surge in investment in clean energy and the demand reductions that are seen in the NZE Scenario.”[12]
As the IEA emphasizes, clean energy development reduces the demand for fossil fuels; forced reduced supply of fossil fuels, on the other hand, causes adverse and counter-productive effects. In other words, clean energy supply precedes fossil fuels phase-out, not the other way around. The IEA prioritizes an orderly transition that aims to safeguard energy security through strong and coordinated policies and incentives that enable all actors to anticipate the rapid changes required, and to minimize energy market volatility and stranded assets.[13] The IEA recognizes that coal-to-gas switching is reducing emissions, particularly in the U.S.[14]
The rapid transition of electric power systems away from fossil fuels to meet net-zero emissions targets is introducing substantial new risks to electric power systems. A transition of the electric power system that produces reduced amounts of electricity, less reliable electricity and/or more expensive electricity to achieve net-zero goals would be a tourniquet that restricts the lifeblood of modern society and hampers development and will thwart sustainability efforts.
The debate is then between imposition of certain, intolerable risks from the rapid transition away from fossil fuels, versus the highly uncertain future impacts from climate change. This conflict can be resolved by relaxing the time horizon for reducing CO2 emissions while maintaining energy abundance, reliability and security through the energy transition.
The energy transition can be facilitated with minimal regrets by:
Accepting that the world will continue to need and desire much more energy – energy austerity such as during the 1970s is off the table.
Accepting that we will need more fossil fuels in the near term to maintain energy security and reliability and to facilitate the transition in terms of developing and implementing new, cleaner technologies.
Continuing to develop and test a range of options for energy production, transmission and other technologies that address goals of lessening the environmental impact of energy production, CO2 emissions and other societal values
Using the next several decades as a learning period with new technologies, experimentation and intelligent trial and error, without the restrictions of near-term targets for CO2 emissions.
In the near term, laying the foundation for zero-carbon electricity is substantially more important than trying to immediately stamp out fossil fuel use. Africa can develop its own natural gas resources. The transition should focus on developing and deploying new sources of clean energy. The transition should not focus on eliminating electricity from fossil fuels, since we will need much more energy to support the materials required for renewable energy and battery storage and building nuclear power plants, as well as to support growing numbers of electric vehicles and heat pumps. And adequate electricity and fuels for transportation, agriculture and industrialization will provide the framework for supporting rapid progress on the Sustainable Development Goals.
[9] Bjorn Lomborg, “Welfare in the 21st Century: Increasing Development, Reducing Inequality, the Impact of Climate Change, and the Cost of Climate Policies,” Technological Forecasting and Social Change 156 (July 2020): 119981, https://doi.org/10.1016/j.techfore.2020.119981.
[10] Giuseppe Formetta and Luc Feyen, “Empirical Evidence of Declining Global Vulnerability to Climate-Related Hazards,” Global Environmental Change 57 (July 2019): 101920, https://doi.org/10.1016/j.gloenvcha.2019.05.004.
[11] Bjørn Lomborg, False Alarm: How Climate Change Panic Costs Us Trillions, Hurts the Poor, and Fails to Fix the Planet (New York, NY: Basic Books, 2020), 218.
[12] “Net Zero Roadmap: A Global Pathway to Keep the 1.5 °C Goal in Reach – Analysis.”
This was a two part appearance by myself on the Gbnews Ana Akua Show.
First we discuss biofuels for plane travel, an ultimate bit of silly virtue signalling. Then how temperature records are fiddled. Joined by Brian Catt a great chap who joins on my side.
This video is an interview by Neil Oliver on GBNews with that ultimate alarmist who appears in this video – Donnachadh McCarthy
Share this:
Global warming, climate change, all these things are just a dream come true for politicians. I deal with evidence and not with frightening computer models because the seeker after truth does not put his faith in any consensus. The road to the truth is long and hard, but this is the road we must follow. People who describe the unprecedented comfort and ease of modern life as a climate disaster, in my opinion have no idea what a real problem is.
We use cookies to personalise content and ads, to provide social media features and to analyse our traffic. We also share information about your use of our site with our social media, advertising and analytics partners. View more
Cookies settings
Accept
Privacy & Cookie policy
Privacy & Cookies policy
Cookies list
Cookie name
Active
Wer wir sind
Textvorschlag: Die Adresse unserer Website ist: https://climate-science.press.
Kommentare
Textvorschlag: Wenn Besucher Kommentare auf der Website schreiben, sammeln wir die Daten, die im Kommentar-Formular angezeigt werden, außerdem die IP-Adresse des Besuchers und den User-Agent-String (damit wird der Browser identifiziert), um die Erkennung von Spam zu unterstützen.
Aus deiner E-Mail-Adresse kann eine anonymisierte Zeichenfolge erstellt (auch Hash genannt) und dem Gravatar-Dienst übergeben werden, um zu prüfen, ob du diesen benutzt. Die Datenschutzerklärung des Gravatar-Dienstes findest du hier: https://automattic.com/privacy/. Nachdem dein Kommentar freigegeben wurde, ist dein Profilbild öffentlich im Kontext deines Kommentars sichtbar.
Medien
Textvorschlag: Wenn du ein registrierter Benutzer bist und Fotos auf diese Website lädst, solltest du vermeiden, Fotos mit einem EXIF-GPS-Standort hochzuladen. Besucher dieser Website könnten Fotos, die auf dieser Website gespeichert sind, herunterladen und deren Standort-Informationen extrahieren.
Cookies
Textvorschlag: Wenn du einen Kommentar auf unserer Website schreibst, kann das eine Einwilligung sein, deinen Namen, E-Mail-Adresse und Website in Cookies zu speichern. Dies ist eine Komfortfunktion, damit du nicht, wenn du einen weiteren Kommentar schreibst, all diese Daten erneut eingeben musst. Diese Cookies werden ein Jahr lang gespeichert.
Falls du ein Konto hast und dich auf dieser Website anmeldest, werden wir ein temporäres Cookie setzen, um festzustellen, ob dein Browser Cookies akzeptiert. Dieses Cookie enthält keine personenbezogenen Daten und wird verworfen, wenn du deinen Browser schließt.
Wenn du dich anmeldest, werden wir einige Cookies einrichten, um deine Anmeldeinformationen und Anzeigeoptionen zu speichern. Anmelde-Cookies verfallen nach zwei Tagen und Cookies für die Anzeigeoptionen nach einem Jahr. Falls du bei der Anmeldung „Angemeldet bleiben“ auswählst, wird deine Anmeldung zwei Wochen lang aufrechterhalten. Mit der Abmeldung aus deinem Konto werden die Anmelde-Cookies gelöscht.
Wenn du einen Artikel bearbeitest oder veröffentlichst, wird ein zusätzlicher Cookie in deinem Browser gespeichert. Dieser Cookie enthält keine personenbezogenen Daten und verweist nur auf die Beitrags-ID des Artikels, den du gerade bearbeitet hast. Der Cookie verfällt nach einem Tag.
Eingebettete Inhalte von anderen Websites
Textvorschlag: Beiträge auf dieser Website können eingebettete Inhalte beinhalten (z. B. Videos, Bilder, Beiträge etc.). Eingebettete Inhalte von anderen Websites verhalten sich exakt so, als ob der Besucher die andere Website besucht hätte.
Diese Websites können Daten über dich sammeln, Cookies benutzen, zusätzliche Tracking-Dienste von Dritten einbetten und deine Interaktion mit diesem eingebetteten Inhalt aufzeichnen, inklusive deiner Interaktion mit dem eingebetteten Inhalt, falls du ein Konto hast und auf dieser Website angemeldet bist.
Mit wem wir deine Daten teilen
Textvorschlag: Wenn du eine Zurücksetzung des Passworts beantragst, wird deine IP-Adresse in der E-Mail zur Zurücksetzung enthalten sein.
Wie lange wir deine Daten speichern
Textvorschlag: Wenn du einen Kommentar schreibst, wird dieser inklusive Metadaten zeitlich unbegrenzt gespeichert. Auf diese Art können wir Folgekommentare automatisch erkennen und freigeben, anstatt sie in einer Moderations-Warteschlange festzuhalten.
Für Benutzer, die sich auf unserer Website registrieren, speichern wir zusätzlich die persönlichen Informationen, die sie in ihren Benutzerprofilen angeben. Alle Benutzer können jederzeit ihre persönlichen Informationen einsehen, verändern oder löschen (der Benutzername kann nicht verändert werden). Administratoren der Website können diese Informationen ebenfalls einsehen und verändern.
Welche Rechte du an deinen Daten hast
Textvorschlag: Wenn du ein Konto auf dieser Website besitzt oder Kommentare geschrieben hast, kannst du einen Export deiner personenbezogenen Daten bei uns anfordern, inklusive aller Daten, die du uns mitgeteilt hast. Darüber hinaus kannst du die Löschung aller personenbezogenen Daten, die wir von dir gespeichert haben, anfordern. Dies umfasst nicht die Daten, die wir aufgrund administrativer, rechtlicher oder sicherheitsrelevanter Notwendigkeiten aufbewahren müssen.
Wohin deine Daten gesendet werden
Textvorschlag: Besucher-Kommentare könnten von einem automatisierten Dienst zur Spam-Erkennung untersucht werden.


