

From NoTricksZone
By P Gosselin on 21. February 2023
Do you feel helpless when trying to assess the veracity of “climate doom is looming” claims we are constantly bombarded with?
For ordinary citizens, it seems nearly impossible to tell right from wrong when it comes to assess such claims. Don’t give up trying to understand the relevant basics, there is a rather simple way to get an idea about what this is all about.
Even without a scientific background, most people have at least a good common sense. And that’s all it takes to get a grasp of how energy flows back and forth between earth’s surface and the skies.
By Fred F. Mueller

Fig. 1. A thin veil of haze from an upcoming bad weather front is drifting in from the left side under a nice constellation of high altitude clouds.
Preceding chapters, see part 1 1), part 2 2), part 3 3).
In this chapter, we will look at findings showing how clouds influence the surface radiation energy balance over longer time periods (years to decades) and at the “eternity” claims with respect to the residence of CO2 in the atmosphere.
The longer-term cooling effects of clouds
The German weather service 4) (DWD, Deutscher Wetterdienst), a scientific institution that is strictly adhering to the IPPC narratives about climate change, states that “clouds have….a cooling effect in the shortwave (SW) wavelength range and a warming effect in the longwave wavelength (LR) range, respectively. The resulting net effect of clouds on the radiative balance is estimated to be around -20 Wm-2, averaged over the entire globe. This implies that clouds reduce the energy at the surface, i.e. they currently cool the climate. The radiative effect of the clouds is about four to five times larger than the radiative effect expected from a doubling of CO2 concentration”.
Comparable assessments come from the US National Oceanic and Atmospheric Administration (NOAA). Their specialists are monitoring cloud radiative effects 5) (CRE) by comparing the upwelling radiation in cloudy and non-cloudy regions. Their conclusion is that cloud conditions exert a global annual shortwave (SW) CRE of about -50 W/m2 while their longwave (LW) CRE amounts to 30 W/m2, resulting in a global mean CRE of some -20 W/m2, which is more than six times higher than the +3.222 W/m2 attributed to “greenhouse gases”. This strong net cooling effect is identical to the figure advanced by the DWD.
But afterwards, the NOAA authors switch to rather nebulous statements, probably being well aware that their facts clash with the climate mantra their organisation is officially supporting in line with the IPCC doctrine. In carefully worded sentences, they caution that due to the large magnitude of these SW and LW CRE effects, the sign of the cloud feedback on climate change cannot be determined from results obtained using current climate measurements. Instead, they warn that the sign of the feedback depends on how sensitive the properties are that govern the LW and SW CRE, thus relativizing their own findings.
Finally, they state that estimates of cloud feedback “require process-level understanding and modelling of the nontrivial factors on which clouds depend”. The crowning highlight of this exercise in obfuscation is: “since clouds modify the general circulation and hydrologic cycle through their interactions with the atmosphere, ocean, and land, comprehensive global climate models are seen as a crucial tool in our quest for an adequate understanding of the interactions between clouds and climate”. In other words, readers are asked to distrust proven scientific findings and wait for new climate simulation software instead.
Are clouds realistically modelled?
Cloud modelling is an undertaking that may have something in common with the development of nuclear fusion: the timescale is dynamically linked to the current date and is postponed again every time one asks. The reality is that the modelling of cloud formation and evolution is still in its infancy stages, and will probably remain there for quite some more time. Besides the presence of over-saturated water vapor, another decisive factor in the formation of clouds is the type and spatial density of aerosol particles that are needed as nuclei for the germination of water droplets. Under near-surface conditions, water droplets will find sufficient nuclei e.g. on surfaces to form water droplet or ice crystals at undercooling levels just one or two °C below the dew point. But in high-altitude conditions, the necessary level of undercooling will readily jump below -10 °C or even beyond -30 to -40 °C. This can be observed when airplanes flying at high altitude produce chemtrails: their exhaust gases contain tiny soot particles that serve as nuclei for the water vapor molecules that seize the opportunity to form ice particles around them, see Fig. 2:

Fig. 2. A passenger jet flying at high altitude in a clear blue sky. The turbines emit tiny soot particles readily accepted as condensation nuclei by the over-saturated water vapor in the surrounding air. The ensuing chemtrails consist of minuscule ice particles.
A realistic assessment of the density and characteristics of the aerosols needed to form clouds at the altitudes where clouds form would require instrumentation of a quality and in quantities that are – at the current state of science – hardly achievable.
Clouds thus remain a still unsolved challenge for climate modelling endeavours since they bring about their own and quite strong contribution to the energy balance of the earth’s surface separately and in addition to what is attributed to greenhouse gases and to water vapor acting as a greenhouse gas in itself.
Quicksand around “CO2 as sole knob” pillar of established climate science
When we talk about clouds, we also have to talk about rain. It is obvious that higher temperatures should bring about more evaporation and transpiration. But the residence time of a water molecule in the atmosphere 6) is estimated to be just 10 days. The mainstream climate science thus pretends that although having a high temporary impact, temperature-related changes in water vapor “remain limited in magnitude by how much the water vapor amount is physically able to change as it approaches its new equilibrium distribution”, as stipulated by PhD Andrew Lacis 7).Lacis is one of the leading protagonists of the science community that shaped the current IPPC climate narratives together with co-authors such as Hansen and Trenberth. The argument goes that “water vapor and clouds can only act to magnify an initial radiative perturbation, but cannot act on their own initiative to manufacture or impose a sustained warming or cooling trend on global climate, even though they may contribute more strongly to the overall atmospheric radiative structure than the radiative-forcing GHGs that actually drive and control the global temperature trend”. No proof is forwarded to support this thesis. Instead, it is maintained that “CO2 and the minor GHGs….once introduced into the atmosphere….effectively remain there indefinitely because they do not condense or precipitate at the prevailing atmospheric temperatures while continuing to exert their radiative forcing. Is the term “indefinitely” really rock-solid?
Contrary to IPCC claims, atmospheric CO2 depends on more parameters than human emissions
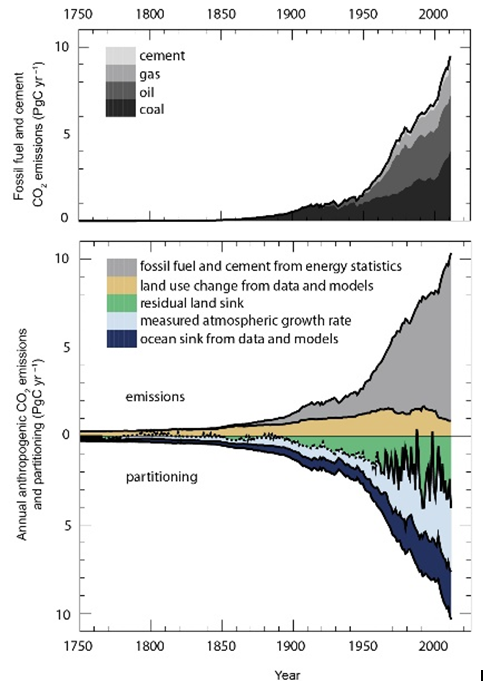
In reality, the statement from A. Lacis is a surprisingly massive denial of well-established results of scientific research. Even the IPCC concedes that together with sources of anthropogenic CO2 emissions, there are also massive natural sinks such as the oceans and land sinks, see Fig. 3. Compare the enormous jitters of the black delineation line between the green and the light blue fields to the much steadier upper black line topping the emissions budget.

Fig. 3. The main sources and sinks for anthropogenic CO2 emissions according to the IPCC (Graphics: WG1AR5 8))
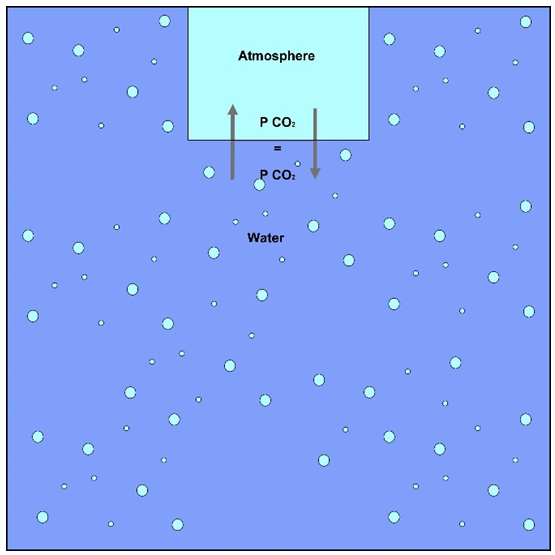
Furthermore, there is an important law of physical chemistry that A. Lacis ignores. This is Henry’s Law 9), which describes the equilibration of gas partial pressures between water and the atmosphere. Excess partial pressure on one side of the surface will result in the corresponding gas to transit the surface between the two media until the balance between the two partial pressures is restored, see Fig. 4:

Fig. 4. Henry’s law stipulates that the partial pressures of a gas soluble in a liquid will equilibrate with the partial pressure of the same gas in the atmosphere by transiting through the surface until equilibrium is reached 10) . The percentage of the gas finally staying in the water is depending on the volumes. Given the enormity of the water masses in the oceans in comparison with the very small gas mass of the atmosphere, earth’s oceans will sooner or later take up 98 % of any additional CO2 injected into the atmosphere. Physical chemistry goes against the talk of “eternity”.
In the case of the oceans, this means that 98 % of all CO2 added to the atmosphere e.g. by human activities will end up there, since their carbon reservoir content of ~ 38,000 Gigatons (1 Gt = 1 Petagram, Pg) is 49 times bigger than that of the atmosphere, which contains just 800 Gt of carbon in the form of CO2. The NOAA states that it just takes one year 11) for the surface ocean to equilibrate with additional CO2 that has been added to the atmosphere. Numerous researchers such as Harde 12), who speaks of just four years, claim that the actual residence time of additional CO2 introduced into the atmosphere is way below the “eternity” as claimed by the Lacis.
And there is a second aspect of Henry’s law that is being ignored by Lacis’ stance on the longevity of CO2 additions to the atmosphere: the exchange of CO2 between the oceans and the atmosphere depends not only on the partial pressures in both media, but also on the temperature of the water. As everybody knows, warming water reduces its solubility for gases, including the gas CO2. That’s why fizzy drinks are served cold, see Fig. 5:

Fig 5. Fizzy drinks are refreshing due to their CO2 content. That’s why they are served cold because the CO2 bubbles away as the liquid warms up.
And since climate science maintains that mankind has warmed earth by more than 1 °C since 1750, this also affects the oceans and their massive CO2 content. The current climate science remains astonishingly muted with respect to this aspect. It seems that the CO2 “knob” so much touted by climate science has more levers than just the burning of fossil fuel.
The puzzling rain paradox
A warmer planet implies that more water will evaporate (or be transpired by plants) into the atmosphere. This in turn means more clouds and ultimately also more rain, since the mean residence time of water molecules 13) in the atmosphere until it returns down to earth is just about 8-10 days. This is confirmed by two independent publications from NASA 14) and L. Jaeger 15), see Fig. 6:

Fig. 6. Graph of global rainfall height with a 5-year moving average trend line. (Data from NASA 14) and L. Jaeger 15)
The trend line in Fig. 6. confirms that over the 20th century, we had a slight positive trend in global downpour quantities. Unfortunately, both projects generating the data have been discontinued around the start of the 21st century. Additionally, rainfall monitoring has in the meantime been shifting to satellite-based data acquisition. L. Jaeger has extended his commendable assembly of rainfall recordings that he stopped after 2002 by using simulation results established by the IPCC for the complete 21st century. Despite intensive search, it has not been possible to identify other freely accessible sources offering comparable rainfall data. Instead of global data, the focus now seems to be on regional or national datasets.
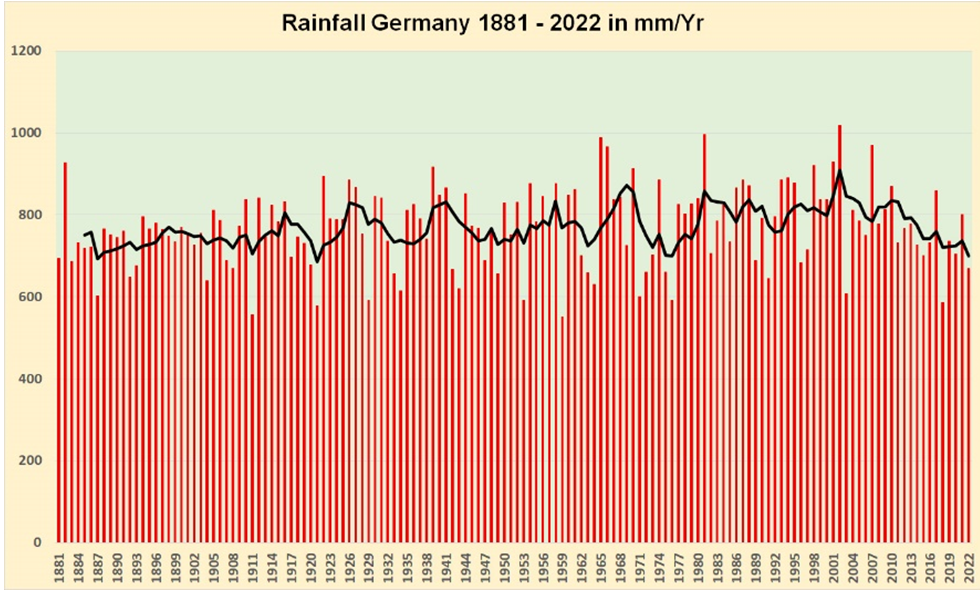
In order to complement the global picture with a regional one, Fig. 7. showcases the nationwide rainfall statistic for Germany for the years 1881 to 2022:

Fig. 7. Germany’s national rainfall statistic for the years 1881 – 2022 with a 5-year moving average trend line. Graph established with data from the German Weather Service DWD 16)
Comparing both graphs, it is interesting to note that while for the years before 2003, linear trend analyses for both show a clear positive trend with an increase of 0.33 mm/yr for the global trend and a much higher value of 0.76 mm/yr for Germany. For the years after 2002, Fig.7. shows a marked downward trend shift. Unfortunately, this shift cannot be verified for the global rainfall compilation (Fig. 6.) since the last available real datasets were established 2002, while the remainder has been filled up with simulated data. This is all the more deplorable since it prevents the comparison of the highly interesting time period of the last 20 years.
More about this in the next chapter, which will also focus on the variability of rain, cloud cover and energy balances. Stay tuned!
Sources
1) https://notrickszone.com/2023/01/14/the-science-that-cuts-corners/
2) https://notrickszone.com/2023/01/18/deplorably-unrealistic-models/
3) https://notrickszone.com/2023/01/27/stronger-than-effects-of-gases/
4) https://www.dwd.de/EN/wolkenbeobachtung.html
5) https://www.gfdl.noaa.gov/cloud-radiative-effect/
6) https://www.britannica.com/science/hydrosphere/The-water-cycle
7) https://pubs.giss.nasa.gov/abs/la00500y.html
8) https://www.ipcc.ch/site/assets/uploads/2018/02/.pdf
9) https://en.wikipedia.org/wiki/Henry%27s_law
10) https://notrickszone.com/2021/06/19/decided-by-courts/
11) https://www.pmel.noaa.gov/co2/story/20circulation
12) Scrutinizing the carbon cycle and CO2 residence time ScienceDirect
13) https://hess.copernicus.org/articles/21/779/2017/
14) Data.GISS: Precipitation Data (CRU TS 2.0): Graphs (nasa.gov)
15) https://www.klima-warnsignale.uni-hamburg.de/lobale-niederschlag/
16) https://www.dwd.de/zeitreihen/zeitreihen.html#buehneTop

You must be logged in to post a comment.