

From Jennifer Marohasy
January 28, 2023 By jennifer
On Friday (3rd February 2023), I will be appearing as an expert witness in the Administrative Appeals Tribunal in Brisbane. The hearing is about a Freedom of Information (FOI) request that has been denied my husband, Dr. John Abbot, for over three years. The information, I will argue, needs to be made public, to enable some assessment of the reliability, or otherwise, of temperatures as recorded at official Australian Bureau of Meteorology weather stations.
Claims that we are facing a climate catastrophe because temperatures will soon be exceeding 1.5 °C is driving the closure of coal mines, caps on the price of gas and a mental health epidemic amongst children who increasingly fear global warming.
Temperature measurements as published by the Australian Bureau of Meteorology, and other such weather bureaus around the world, are at the heart of the concern, because they purportedly show an unprecedented increase, particularly over recent years.
While on the one hand in correspondence to me the Director of the Bureau Andrew Johnson has claimed temperature measurements from the platinum resistance probes, which now replace mercury thermometers at most official recording stations, are equivalent, the Bureau at the same time has made changes to official temperatures as recorded at Cape Otway Lighthouse theoretically* of 0.5 °C for the 84 years from 1910 to 1994 based on the instrument change – temperatures have according to the ACORN-SAT Station Adjustment Summary been dropped down from 15th April 1994 back to 1st January 1910 by 0.5 °C because the Bureau estimates that this is the effect of the change from mercury thermometer to probe on these historic temperatures.
It is important to note that by cooling the past by 0.5 °C, rather than, for example, increasing the value recorded from the probe each day, the Bureau has been theoretically under reporting the temperatures from Cape Otway lighthouse by 0.5 °C since 15th April 1994.
This difference of 0.5 °C – that is one third of the dread 1.5 °C that is driving the closure of coal mines, caps on the price of gas and a mental health epidemic amongst children who increasingly fear global warming – is only an estimate by the Bureau.
The Bureau cannot know the exact amount because the mercury thermometer was removed at the same time the probe was installed at the weather station at Cape Otway lighthouse. The mercury thermometer that was removed on 15th April 1994 had been faithfully used to measure maximum temperatures at Cape Otway lighthouse since 1865 – for 129 years. This information can be found in the Metadata for Cape Otway.
While the mercury thermometer had been good for 129 years, the probe needed replacing after just 14 years, on 11th November 2010 according to the Metadata for Cape Otway.
According to the ACORN-SAT Station Adjustment Summary no additional changes were made to the official historical temperatures following the installation of the second probe.
It is therefore reasonable to assume that temperatures at Cape Otway light house, temperatures that are incorporated into global databases used to calculate global warming, are still reliably 0.5 °C cooler than the ‘real temperature’, in other words the temperature as it would be recorded by a mercury thermometer.
If we add this 0.5 °C to 1.47 °C, which is how much the Bureau estimates Australia has warmed since 1910, then the tipping point of 1.5 °C has already been exceeded!
This should be of immense concern to climate activists. They should be screaming for an audit of temperature measurements.
Because the only way we can know for sure whether the tipping point of 1.5 has been exceeded, or not, is if the parallel data from the 34 weather stations where the Bureau claims to be recording temperatures from mercury thermometers and temperature probes at the same weather station is made public. Then we can know if the probes really do record 0.5 °C cooler than mercury thermometers that were historically used to measure temperatures.
The Bureau has variously claimed that it cannot make this parallel data public because it would be too onerous to scan all the A8 Forms that have the maximum temperatures as recorded manually (written by hand onto paper) from the mercury thermometer each day next, to the digitally recorded temperature from the probe.
More recently the Bureau has claimed that it cannot make this information public because it does not exist, or variously that an A8 Form is not a document and therefore not subject to John Abbot’s FOI request.
Following the intervention of then Environment and Energy Minister Josh Frydenberg back in October 2017, I was provided with over 10 681 scanned A8 pages for the period from 1 January 1989 to 31st January 2015). With the assistance of colleagues, I manually transcribed over 4 000 of these A8 Forms beginning 1 November 1996.
Analysis of this data indicates that the first probe at Mildura did indeed record temperatures too cool relative to the mercury thermometer, but the third probe that is now in place records temperatures too hot sometimes by as much as 0.4 °C. If this is indeed the case more generally at weather stations across Australia, then it is possible that the tipping point of 1.5 °C may have been exceeded by nearly one whole degree Celsius, more specifically by 2.37 °C.
We can only know if the parallel data is made public, facilitating an accurate assessment of the change in temperatures across the landmass of Australia since at least 1910.
________
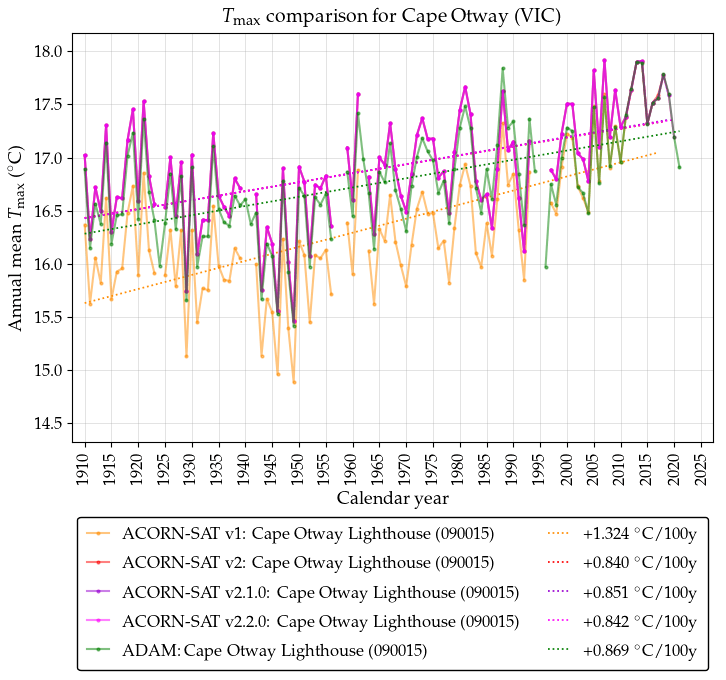
* While the 2014 ACORN-SAT Station Adjustment Summary claims that the only change to Cape Otway maximum temperatures for the period before 15 April 1994 is a dropping-down of 0.5 °C in reality, scrutiny of the ACORN-SAT data currently at the Bureau’s website shows that the change is closer to one degree. To be sure the ADAM (Australian Data Archive for Meteorology) database shows a value of 15.7 °C for Cape Otway for 14th April 1994, and ACORN-SAT (Australian Climate Observations Reference Network) a value of 15.2 °C. Considering the values for 16th April 1994, the ADAM database shows 21.7 °C as the maximum temperature at Cape Otway Lighthouse, while ACORN-SAT shows 22.2 °C. These four values suggest that the Bureau not only cooled the temperatures before installation of the probe by 0.5 °C, but also warmed temperatures after installation by 0.5 °C. So overall the change is 1.0 °C following the installation of the probe. This suggests the probe has actually had a full one degree affect on temperatures. ACORN-SAT is the official homogenised database used to calculate climate change statistics. Values in the ACORN-SAT database are considered an ‘improvement’ on the ADAM values.
I show the effect of the different versions of ACORN-SAT on the original ADAM values in my interactive table unique to this website, and specifically for Cape Otway here: https://jennifermarohasy.com/wp-content/uploads/2022/03/Tmax_090015.png
The ADAM values can be found here: http://www.bom.gov.au/climate/data/
The ACORN-SAT values can be found here: http://www.bom.gov.au/climate/data/acorn-sat/#tabs=Data-and-networks
Metadata for Cape Otway Lighthouse including instrument changes can be found here: http://www.bom.gov.au/clim_data/cdio/metadata/pdf/siteinfo/IDCJMD0040.090015.SiteInfo.pdf
In the following tables I annotate the relevant information in Metadata document and ACORN-SAT Adjustment Summary.
Table 1.

These are the listed equipment changes as described in the Metadata for Cape Otway Lighthouse, that can be downloaded from the Bureau website here: http://www.bom.gov.au/clim_data/cdio/metadata/pdf/siteinfo/IDCJMD0040.090015.SiteInfo.pdf. They show that the temperature probe was installed on 15th April 1994, and the mercury thermometer removed on 14th April 1994. The dashed blue suggests that a mercury thermometer was later installed on 30 October 2002 before being removed on 5th December 2012 suggesting there should be 10 years of parallel data.
Table 2.

This is an extract from the Bureau’s ‘ACORN-SAT Station Adjustment Summary’ that was provided to me via journalist Graham Lloyd in 2014. This document is not publicly available and presumably has been updated since 2014, given the changes that have been made to the ACORN-SAT data base during this period.
The ACORN-SAT Station Adjustment Summary, as provided to me in 2014 can be downloaded here.
The feature image at the top of this blog post is of Cape Otway lighthouse. Cape Otway Lighthouse is the oldest surviving lighthouse on mainland Australia. Built in 1848, the lighthouse sits 90 metres above the ocean of Bass Strait.

You must be logged in to post a comment.