


By Roy W. Spencer, Ph. D.
Summary
Comparison of rural with urban temperature monitoring sites across Canada during the summers of 1978-2022 shows the expected average nighttime warm bias in urban areas, with a weaker daytime effect. When applied to the Landsat imagery-based diagnoses of increased urbanization over time, 20% of the temperature trends in a small region encompassing Calgary and Edmonton are found to be due to increasing urbanization. Calgary leads the list of Canadian cities with increased urbanization, with an estimated 50% of the nighttime warming trends across 10 Canadian mostly-metro areas attributable to increased urbanization, and 20% of the daytime warming trends.
Introduction
This is part of my continuing investigation of the degree to which land-based temperature datasets are producing warming trends exaggerated by increasing urbanization (the urban heat island effect, UHI). Current “homogenization” techniques for thermometer data adjustment do not explicitly attempt to correct urban trends to match rural trends, although I would expect that they do perform this function if most of the stations are rural. Instead, they amount to statistical “consensus-building” exercises where the majority wins. So, if most of the stations are affected by increasing UHI effects, to varying degrees, these are not forced to match the rural stations. Instead, the reverse occurs. For example, in the U.S. the Watts et al. analysis of station data showed that the U.S. homogenized dataset (USHCN) produced temperature trends as large as those produced by the stations with the worst siting in terms of spurious heat sources. They further found that use of only well-sited thermometer locations leads to substantial reductions in temperature trends compared to the widely used homogenized dataset.
I consider homogenization to be a black-box approach that does not address the spurious warming in thermometer records resulting from widespread urbanization over time. My approach has been different: Document the absolute temperature differences between station pairs and relate that to some independent measure of urbanization difference. The Landsat-based global dataset of “built-up” areas (which I will loosely refer as measures of urbanization) offers the opportunity to correct for urbanization in thermometer data extending back to the 1970s (when the Landsat series of satellite started).
My main region of focus to start has been the southeast U.S., partly because my co-researcher, John Christy, is the Alabama state climatologist, and I am partly funded through that office. But I am also examining other regions. So far, I’ve done some preliminary analysis for the UK, France, Australia, China, and Canada. Here I will show some initial results for Canada.
The first step is to quantify, from closely spaced stations, the difference in monthly-average temperatures between more-urban and more-rural sites. The temperature dataset I am using is the Global Hourly Integrated Surface Database (ISD), archived on a continuing basis at NOAA/NCEI. The data are dominated by operational hourly (or 3-hourly) observations made to support aviation at airports around the world. They are mostly (but not entirely) independent of the maximum and minimum (Tmax and Tmin) measurements that make up other widely used and homogenized global temperature datasets. The advantages of the ISD dataset are the hourly time resolution, allowing more thorough investigation of day vs. night effects, and better instrumentation and maintenance for aviation safety support. A disadvantage is that there are not as many stations in the dataset compared to the Tmax/Tmin datasets.
As I discussed in my last post on the subject, a critical component to my method is the relatively recent high-resolution (1 km) global dataset of urbanization derived from the Landsat satellites since 1975 as part of the EU’s Global Human Settlement (GHS) project. This allows me to compare neighboring stations to quantify how much urban warmth is associated with differences in urbanization as diagnosed from Landsat imagery of “built-up” structures.
Urban vs. Rural Summertime Temperatures in Canada
Canada is a mostly rural country, with widely scattered temperature monitoring stations. Most of the population (where most of the thermometers are) is clustered along the coasts and especially along the U.S. border. There are relatively few airports compared to the size of the country which limits how many rural-vs-urban matchups I can make.
For 150 km maximum space between station pairs, as well as a few other tests for inclusion (e.g., less than 300 m elevation difference between stations), Fig. 1 shows the differences in average temperature and area-average Landsat-based urbanization values for (a) 06 UTC (late night) and (b) 21 UTC (afternoon). These times were chosen to approximate the times of minimum and maximum temperatures (Tmin and Tmax) which make up other global temperature datasets, so I can do a comparison to them.


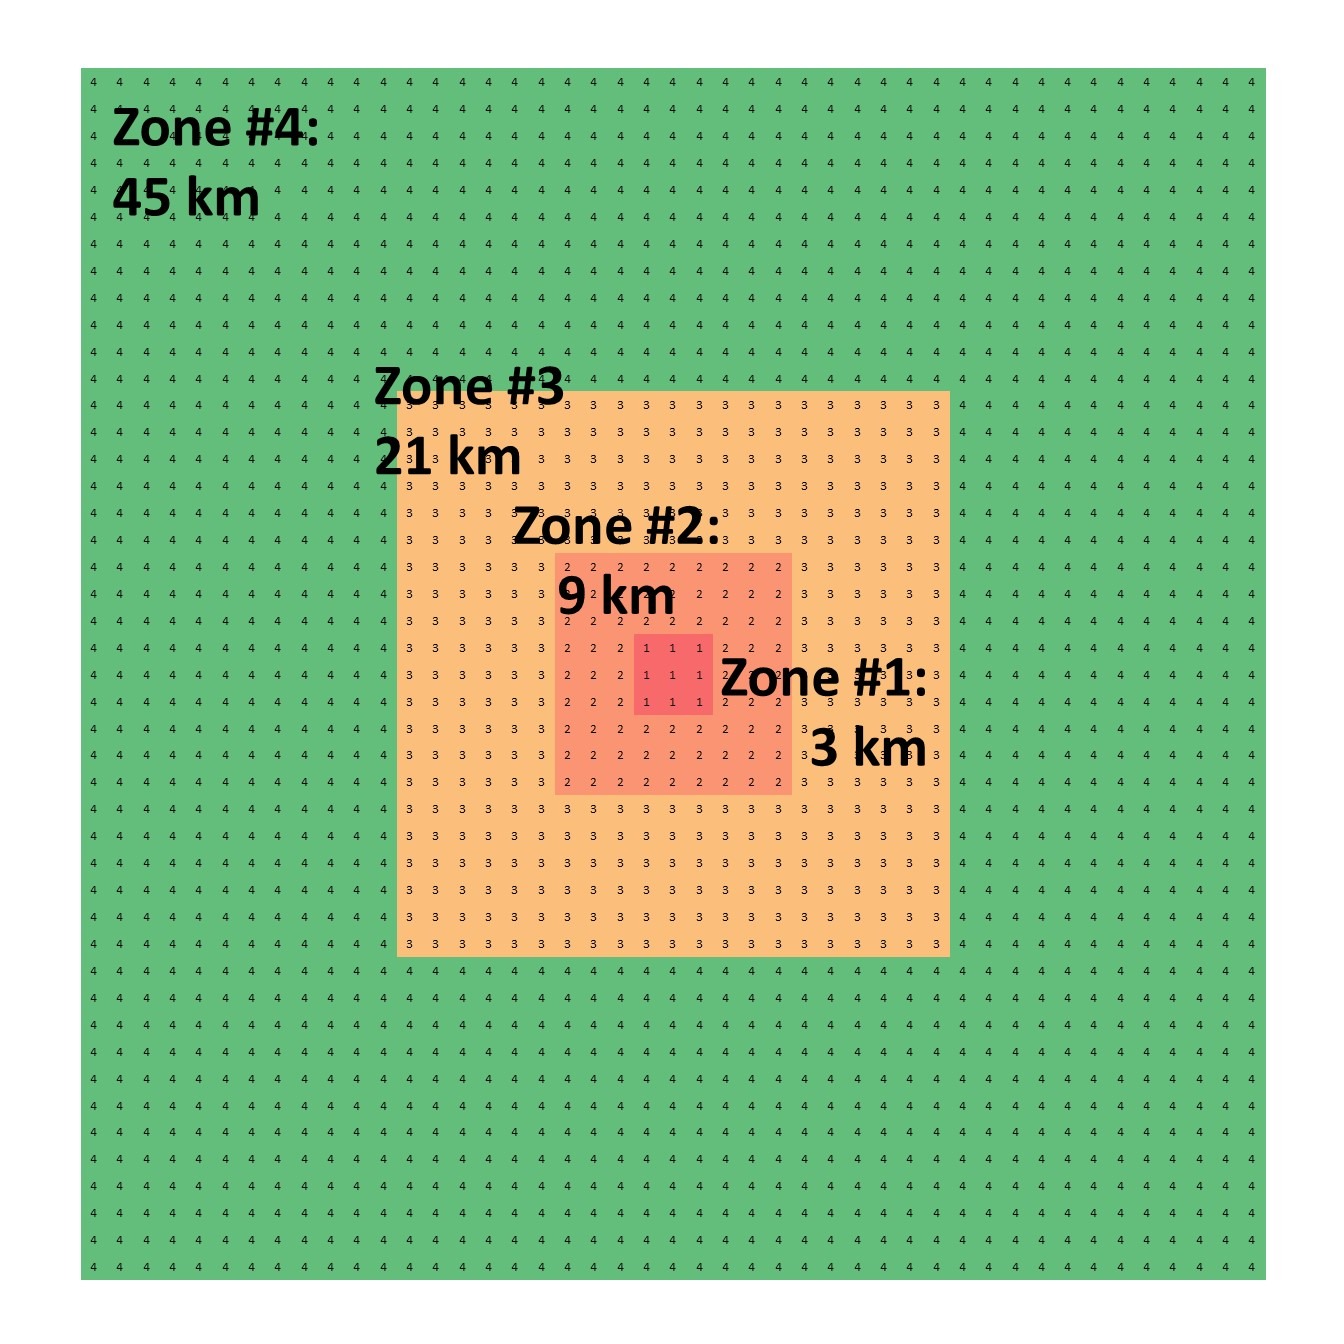
Fig. 1 Comparison of closely spaced Canadian station differences in temperature versus Landsat-based urbanization estimates for (a) nighttime and (b) daytime. Data included are monthly average temperatures for June, July, and August for the years 1988-1992, 1998-2002, and 2012-2016, which correspond to the Landsat dataset years of 1990, 2000, and 2014. There were not sufficient thermometer data in the ISD archive to use with the 1975 Landsat urbanization estimates. The area-averaging Zone 3 is ~21×21 km in size, centered on each station.
As other studies have documented, the UHI effect on temperature is larger at night, when solar energy absorbed into the ground by pavement (which has high thermal conductivity compared to soil or vegetation) is released into the air and is trapped over the city by the stability of the nocturnal boundary layer and weaker winds compared to daytime. For this limited set of Canadian station pairs the UHI warm bias is 0.21 deg. C per 10% urbanization during the day, and 0.35 deg. C per 10 % at night.
Next, if we apply these relationships to the monthly temperature and urbanization data at ~70 individual stations scattered across Canada, we get some idea of how much increasing urbanization has affected temperature trends. (NOTE: the relationships in Fig. 1 only apply in an average sense, and so it is not known how well they apply to the individual stations in the tables below.)
Across approximately 70 Canadian stations, the 10 stations with the largest diagnosed spurious warming trends (1978-2022) are listed below. Note that the raw trends have considerable variability, some of which is likely not weather- or climate-related (changes in instrumentation, siting, etc.). Table 1 has the nighttime results, which Table 2 is for daytime.
TABLE 1: Most Urbanized Nighttime Temperature Trends (1978-2022)
| Location | Raw Temp. Trend | De-urbanized Trend | Urban Trend Component |
| Calgary Intl. Arpt. | +0.33 C/decade | +0.16 C/decade | +0.17 C/decade |
| Ottawa Intl. Arpt. | +0.07 C/decade | -0.08 C/decade | +0.14 C/decade |
| Windsor | +0.20 C/decade | +0.08 C/decade | +0.11 C/decade |
| Montreal/Trudeau Intl. | +0.47 C/decade | +0.36 C/decade | +0.10 C/decade |
| Edmonton Intl. Arpt. | +0.10 C/decade | 0.00 C/decade | +0.10 C/decade |
| Saskatoon Intl. Arpt. | +0.03 C/decade | -0.04 C/decade | +0.07 C/decade |
| Abbotsford | +0.48 C/decade | +0.41 C/decade | +0.07 C/decade |
| Regina Intl. | -0.11 C/decade | -0.17 C/decade | +0.06 C/decade |
| Grande Prairie | +0.07 C/decade | +0.02 C/decade | +0.05 C/decade |
| St. Johns Intl. Arpt. | +0.31 C/decade | +0.27 C/decade | +0.04 C/decade |
| 10-STN AVERAGE | +0.19 C/decade | +0.10 C/decade | +0.09 C/decade |
Calgary, Ottawa, Windsor, Montreal, and Edmonton are the five station locations with the greatest rate of increased urbanization since the 1970s as measured by Landsat, and therefore the greatest rate of spurious warming since 1978 (the earliest for which I have complete hourly temperature data). Averaged across the 10 highest-growth locations, 48% of the average warming trend is estimated to be due to urbanization alone.
Table 2 shows the corresponding results for summer afternoon temperatures, which from Fig. 1 we know have weaker UHI effects than nighttime temperatures.
TABLE 2: Most Urbanized Afternoon Temperature Trends (1978-2022)
| Location | Raw Temp. Trend | De-urbanized Trend | Urban Trend Component |
| Calgary Intl. Arpt. | +0.26 C/decade | +0.16 C/decade | +0.11 C/decade |
| Ottawa Intl. Arpt. | +0.27 C/decade | +0.19 C/decade | +0.09 C/decade |
| Windsor | +0.27 C/decade | +0.20 C/decade | +0.07 C/decade |
| Montreal/Trudeau Intl. | +0.35 C/decade | +0.28 C/decade | +0.06 C/decade |
| Edmonton Intl. Arpt. | +0.42 C/decade | 0.36 C/decade | +0.06 C/decade |
| Saskatoon Intl. Arpt. | +0.18 C/decade | +0.13 C/decade | +0.04 C/decade |
| Abbotsford | +0.45 C/decade | +0.40 C/decade | +0.04 C/decade |
| Regina Intl. | +0.08 C/decade | +0.04 C/decade | +0.04 C/decade |
| Grande Prairie | +0.19 C/decade | +0.16 C/decade | +0.03 C/decade |
| St. Johns Intl. Arpt. | +0.31 C/decade | +0.28 C/decade | +0.03 C/decade |
| 10-STN AVERAGE | +0.28 C/decade | +0.22 C/decade | +0.06 C/decade |
For the top 10 most increasingly urbanized stations in Table 2, the average reduction in the observed afternoon warming trends is 20%, compared to 48% for the nighttime trends.
Comparison to the CRUTem5 Data in SE Alberta
How do the results in Table 1 affect widely reported warming trends averaged across Canada? Given that Canada is mostly rural with only sparse measurements, that would be difficult to determine from the available data. But there is no question that the public’s consciousness regarding climate change issues is heavily influenced by conditions where they live, and most people live in urbanized areas.
As a single sanity test of the use of these mostly airport-based measurements of temperature for climate monitoring, I examined the region of southeast Alberta bounded by the latitude/longitudes of 50-55N and 110-115W, which includes Calgary and Edmonton. The comparison area is determined by the IPCC-sanctioned CRUTem5 temperature dataset, which reports average data on a 5-deg. latitude/longitude grid.
There are 4 stations in my dataset in this region and averaging the 4 stations’ raw temperature data produces a trend (Fig. 2) essentially identical to that produced by the CRUTem5 dataset, which has extensive homogenization methods and (presumably) many more stations (which are often limited in their periods of record, and so must be pieced together). This high level of agreement is at least partly fortuitous.


Fig. 2. Monthly average summer (June-July-August) temperatures, 1978-2022, for southeast Alberta, from the IPCC CRUTem5 dataset (green), raw temperatures from 4 stations (red) and de-urbanized 4-station average temperatures (blue). A temperature offset is applied to the CRUTem5 anomalies, so the trend lines intersect in 1978.
Applying the urbanization corrections from Fig. 1 (large for Calgary and Edmonton, tiny for Cold Lake and Red Deer) lead to an average reduction of 20% in the area-average temperature trend. This supports my claim that homogenization procedures applied to global Tmax/Tmin datasets have not adjusted urban trends to rural trends, but instead represent a “voting” adjustment where a dataset dominated by stations with increasing urbanization will mostly retain the trend characteristics of the UHI-contaminated locations.
Conclusions
Canadian cities show a substantial urban heat island effect in the summer, especially at night, and Landsat-based estimates of increased urbanization suggest that this has caused a spurious warming component of reported temperature trends, at least for locations experiencing increased urbanization. A limited comparison in Alberta suggests there remains an urban warming bias in the CRUTem5 dataset, consistent with my previous postings on the subject and work done by others.
The issue is important because rational energy policy should be based upon reality, not perception. To the extent that global warming estimates are exaggerated, so will be energy policy decisions. As it is, there is evidence (e.g., here) that the climate models used to guide policy produce more warming than observed, especially in the summer when excess heat is of concern. If that observed warming is even less than being reported, then the climate models become increasingly irrelevant to energy policy decisions.