
Daily Archives: 15. May 2021
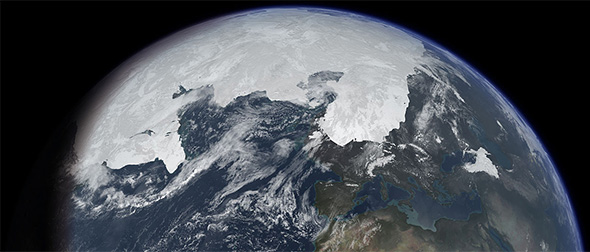
Surprise: The Last Ice Age was colder than anyone thought. Blame CO2!
We panic about the next half degree of warming (above the 1.5 we’ve already had) but the depth of the ice age was savagely cold. For years the experts told us what Earths temperature was then, but apparently they were wrong.
And yet corals and rainforest survived. Plus turtles, whales, kittens — lots of things. And all without research grants.


Nice line on the Nobel gas calibration with ground temperatures. Nice proxy.
Two studies have come out in the last 10 months both showing that at its coldest point about 25,000 years ago, the Earth was on average six degrees cooler Celcius than it is today. And this new study includes estimates of temperatures of tropical land near the oceans which ought to be more stable and less prone to big extremes.
This comes from a newer style of proxy based on nobel gases dissolved in ground water. It appears to be quite an accurate proxy, judging by the graph to the right. And it solves a lot of problems with other proxies. We can take samples from all around the world instead of just the polar ice caps (like we can with ice cores). And it’s not dependent on living things which like higher CO2 levels and inconveniently move location as the climate changes.


Nice line on the Nobel gas calibration with ground temperatures. Nice proxy.
It’s always worse than we thought
“The real significance of our paper is that prior work has badly underestimated the cooling in the last glacial period, which has low-balled estimates of the Earth’s climate sensitivity to greenhouse gases,” said paper co-author Jeffrey Severinghaus, a professor of geosciences at Scripps Institution of Oceanography, University of California San Diego. “The main reason that prior work was flawed was that it relied heavily on species abundances in the past. But just like humans, species tend to migrate to where the climate suits them.
The real significance is that 1. Experts are often wrong. 2. Real climate change is brutal. and 3. We don’t know when the next one is coming.
If this is right, all the other big experts were not. But what’s two or three degrees between friends?


So the study finds that natural climate change is larger than anyone thought, and the next ice age is more scary than anyone realized, but this apparently means CO2 is more awful than ever. It seems the tropics can cool more than anyone thought, therefore they can also warm more than anyone expected. Got that? Because whatever happened, CO2 did it.
“The rather high climate sensitivity that our results suggest is not good news regarding future global warming, which may be stronger than expected using previous best estimates. In particular, our global review reinforces the finding of several single noble gas case studies that the tropics were substantially cooler during the last glacial maximum than at present. The unpleasant implication for the future is that the warmest regions of the world are not immune to further heating,” commented co-author Werner Aeschbach, a professor at the Institute of Environmental Physics, Heidelberg University, Heidelberg, Germany.
Of course, it all comes down to how these proxies are then used to guesstimate the effect of CO2 (while ignoring the effect of every other climate variable).
Don’t get the idea that I’m 100% sold on the deep cold and the new proxy. It’s not confidence building when researchers announce results in terms of CO2 when they didn’t have too. Confirmation bias?
Would you like more circular reasoning with those green colored glasses?
Thanks to obsessive Government funding, the point of every new proxy is to recalculate the “climate sensitivity” of CO2, never to test the climate models, or calculate the effect of the sun, the moon or the effect of space weather on Earth. But they effectively are using a model to find a number that “shows models are right”. If solar-magnetic-wind-or-cosmic-factors affect the climate, the models (and researchers) are oblivious. Instead of finding “the sun did it” they will auto-attribute most of the Sun’s driving force to CO2 instead, because the models assume all those solar effects have zero effect on earths weather. And because the magic stardust of CO2 will always explain all the gaps, researchers will never find out how much influence the solar factors have because they aren’t looking.
The paper does broadly support a recent marine proxy study by Tierney et al. published last year that found substantially greater low-latitude cooling than previous efforts and, in turn, suggested greater climate sensitivity than prior studies. That earlier paper suggested the equilibrium response of Earth’s global-mean surface temperature is 3.4 degrees C per doubling of atmospheric carbon dioxide, in line with the consensus range of estimates from state-of-the-art climate models, but somewhat higher than the usual best estimate of 3.0 degrees C.
“The rather high climate sensitivity that our results suggest is not good news regarding future global warming, which may be stronger than expected using previous best estimates. In particular, our global review reinforces the finding of several single noble gas case studies that the tropics were substantially cooler during the last glacial maximum than at present. The unpleasant implication for the future is that the warmest regions of the world are not immune to further heating,” commented co-author Werner Aeschbach, a professor at the Institute of Environmental Physics, Heidelberg University, Heidelberg, Germany.
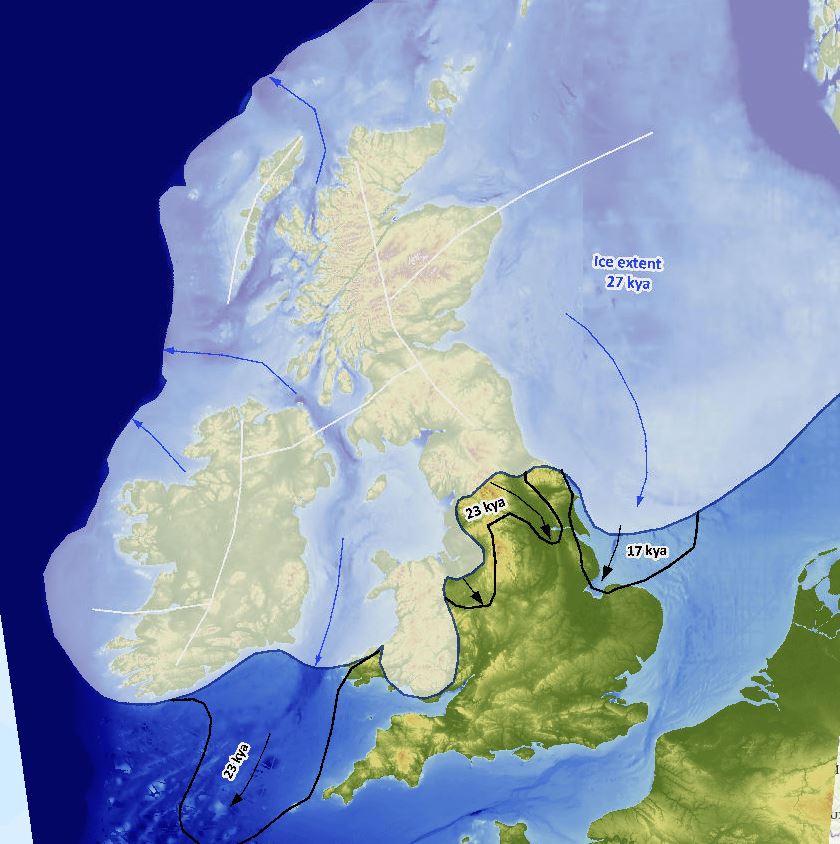
The ice sheets are coming back sometime:
This is where the ice got too last time around in the United Kingdom. What’s the plan for next time?
Last Glacial Maximum, Ice Extent, UK, Map.
REFERENCES
Seltzer, A.M., Ng, J., Aeschbach, W. et al. Widespread six degrees Celsius cooling on land during the Last Glacial Maximum. Nature 593, 228–232 (2021). doi.org/10.1038/s41586-021-03467-6
Jessica E. Tierney, Jiang Zhu, Jonathan King, Steven B. Malevich, Gregory J. Hakim, Christopher J. Poulsen. Glacial cooling and climate sensitivity revisited. Nature, 2020; 584 (7822): 569 DOI: 10.1038/s41586-020-2617-x
Britice project (Map of UK and Ireland)
By Ittiz – Own work, CC BY-SA 3.0, , CC BY-SA 3.0, Link
Last Glacial Maximum: https://en.wikipedia.org/wiki/Last_Glacial_Maximum
via JoNova
May 15, 2021
Supremes Asked to Rule on EPA Energy Authorities


Background from Reed Smith lawyers The fall of Trump’s Affordable Clean Energy Rule and the strengthened EPA authority to regulate greenhouse gases. Excerpts in italics with my bolds
The Affordable Clean Energy Rule
The EPA promulgated the ACE Rule in 2019 under the CAA, replacing the Obama administration’s 2015 Clean Power Plan (CPP). Both rules sought to reduce GHG emissions from the power sector; but where the CPP implemented broader industry-wide mechanisms, the ACE Rule limited reduction efforts to the actual source power plants.
The 2015 CPP offered “beyond the fenceline” tools for states to reduce emissions by replacing fossil fuels with renewable energy sources and participating in emissions credit-trading programs; however, in February 2016 the U.S. Supreme Court stayed the implementation of the CPP pending litigation in the D.C. Circuit. During the stay and subsequent freeze of litigation, the Trump administration rescinded the CPP and promulgated the ACE Rule.
In promulgating the ACE Rule, the Trump EPA took an alternative view of the CAA than the Obama EPA and reasoned that the CAA expressly limited the EPA’s power to only “at the source” emissions reduction options, such as heat rate improvement technologies. As a result, the Trump administration removed all of the CPP’s “beyond the fenceline” options and limited emissions restrictions to those applied directly to power plants.
DC Circuit Court of Appeal Ruling January 19, 2021
Judges Millett and Pillard of the D.C. Circuit Court disagreed with the (Trump) EPA’s interpretation. In the majority opinion, the Court concluded that there is “no bases—grammatical, contextual, or otherwise—for the EPA’s assertion” that its authority was limited to “at the source” controls. In the end, the Court vacated the ACE Rule and remanded it back to the EPA just in time for the Biden administration to take over. The Court’s decision appears to clear the way for the Biden administration to regulate GHG emissions from the power sector.
In his first week in office, President Biden has taken a number of actions to undo many of the Trump administration’s environmental policy decisions, including rejoining the Paris Climate Accord. The new Biden EPA has also requested that the Department of Justice have all Trump-era litigation seeking judicial review of any EPA regulation promulgated between January 20, 2017 and January 20, 2021. Based on the Court’s show of support and the Biden Administration’s actions within the first week, we may see some of the Obama-era or similar regulation brought back to life in the coming months.
Petitions to Supreme Court April 29 and 30, 2021
The May Update at Columbia Climate Law Blog reports the latest development bringing the issue to Supreme Court attention: States and Coal Company Sought Review of D.C. Circuit Decision Vacating Affordable Clean Energy Rule Excerpts in italics with my bolds.
Two petitions for writ of certiorari were filed in the U.S. Supreme Court seeking review of the D.C. Circuit’s January opinion vacating EPA’s repeal and replacement of the Obama administration’s Clean Power Plan regulations for controlling carbon emissions from existing power plants. The first petition was filed by West Virginia and 18 other states that had intervened to defend the repeal and replacement rule, known as the Affordable Clean Energy rule. The states’ petition presented the question of whether Section 111(d) of the Clean Air Act constitutionally authorizes EPA “to issue significant rules—including those capable of reshaping the nation’s electricity grids and unilaterally decarbonizing virtually any sector of the economy—without any limits on what the agency can require so long as it considers cost, nonair impacts, and energy requirements.” They argued that Congress had not clearly authorized EPA to exercise such “expansive” powers and that the D.C. Circuit majority opinion’s interpretation was foreclosed by the statute and violated separation of powers. The states argued that the Supreme Court’s stay of the Clean Power Plan while it was under review by the D.C. Circuit in 2016 signaled that the legal framework for the Clean Power Plan “hinges on important issues of federal that EPA then—and the court below now—got so wrong this Court was likely to grant review.” The states contended that further delay in the Court’s resolution of these “weighty issues” would have “serious and far-reaching costs.”
The second petition was filed by a coal mining company. The coal company’s petition presented the question of whether Section 111(d) “grants the EPA authority not only to impose standards based on technology and methods that can be applied at and achieved by that existing source, but also allows the agency to develop industry-wide systems like cap-and-trade regimes.” The company argued that the D.C. Circuit erred by “untethering” Section 111(d) standards from the existing source being regulated. Like the states, the company contended that Supreme Court had already recognized the critical importance of this question when it stayed the Clean Power Plan.
The company argued that debates regarding climate change and policies to address climate change “will not be resolved anytime soon” but that “what must be resolved as soon as possible is who has the authority to decide those issues on an industry-wide scale—Congress or the EPA.”
EPA’s response to the petitions is due June 3, 2021. West Virginia v. EPA, No. 20-1530 (U.S. Apr. 29, 2021); North American Coal Corp. v. EPA, No. 20-1531 (U.S. Apr. 30, 2021).
Comment: The question of decision authority seems especially urgent since no one knows who is the actual decider for the Executive Branch.
via Science Matters
May 15, 2021 by Ron Clutz
Marc A. Thiessen: An Obama scientist debunks the climate doom-mongers
The Washington Post has published an enlightening opinion piece on climate alarm and climate realism. Mark Thiessen, its weekly columnist, has based his op-ed on an interview with Steve Koonin and his new book ‘Unsettled: What Climate Science Tells Us, What It Doesn’t, and Why It Matters‘ which is making quite a splash due to its matter-of-fact, no-nonsense approach.


U.S. climate envoy John F. Kerry delivered a dire warning Wednesday on “the mounting costs … of global warming and of a more volatile climate.” Last year’s tally of “22 hurricanes, floods, droughts and wildfires shattered the previous annual record of 16 such events, and that was set only four years ago,” Kerry told a congressional hearing. “You don’t have to be a scientist to begin to feel that we’re looking at a trend line.”
Kerry is right about one thing: He is not a scientist. So here are a few climate facts that Kerry failed to mention in his testimony, marshaled by one of the Obama administration’s top scientists, Steven E. Koonin. All are based on official assessments published by the U.S. government or United Nations:“
* The warmest temperatures in the U.S. have not risen in the past fifty years,” Koonin writes, according to the U.S. government’s Climate Science Special Report.
* “Humans have had no detectable impact on hurricanes over the past century,” according to the 2014 National Climate Assessment.
* “Since the middle of the twentieth century, the number of significant tornadoes hasn’t changed much at all, but the strongest storms have become less frequent,” according to National Oceanic and Atmospheric Administration data (NOAA).
* “The rate of global sea-level rise 70 years ago was as large as what we observe today,” according to the U.N. Intergovernmental Panel on Climate Change (IPCC).
* Instead of droughts, “the past fifty years have been slightly wetter than average” in the United States, according to NOAA figures.
* Rather than famine, “in the fifty years from 1961 to 2011, global yields of wheat, rice, and maize … each more than doubled,” according to the IPCC.
* “The net economic impact of human-induced climate change will be minimal through at least the end of this century.”
These facts come from Koonin and his new book, “Unsettled: What Climate Science Tells Us, What It Doesn’t, and Why It Matters.”
When he shares such information, he writes, “most are incredulous. Some gasp. And some get downright hostile.” Koonin — a physicist who worked on alternative energy for BP and as undersecretary for science in Obama Energy Department — has dug through those U.N. and U.S. government reports to bring us some inconvenient truths. And he says the facts do not support the “doom mongering” of climate alarmists.
The globe is warming, he tells me in an interview, partly due to natural phenomena and partly due to growing human influences. (Scientists can’t untangle the two, he writes, due to “the deficiencies of climate data.”) But, Koonin argues, the terrifying predictions of increasingly violent weather and coastal cites drowned beneath rising seas are overblown.
So are the predictions of climate-induced economic devastation. Koonin explains that, if the U.S. economy grows at a 2 percent average annual rate, then absent any climate impact gross domestic product will rise from about $20 trillion today to about $80 trillion in 2090. If temperatures rise by 5 degrees Celsius over that same period, Koonin notes that, according to the 2018 National Climate Assessment, our growth would be 4 percent less 70 years from now. That means GDP would grow to about $77 trillion instead of $80 trillion. “We would be delayed in our growth by a couple of years,” he says.
The idea that we can stop climate change, Koonin argues, is delusional.
Full story ($)
The post Marc A. Thiessen: An Obama scientist debunks the climate doom-mongers appeared first on The Global Warming Policy Forum.
via The Global Warming Policy Forum
May 15, 2021
Answer to a review of Seim and Olsen paper: “The influence of IR Absorption and Backscatter Radiation from CO2”


By Thorstein Seim and Borgar T. Olsen
A review in WattsUpWithThat was performed on our paper by Kevin Kilty. It is found here. The reviewer´s criticism of the paper was summed in 3 points:
- The construction, calibration and use of the IR sensors.
- The energy balance calculation which searches for, but cannot locate leaks of energy to explain the null result.
- The many explicit and implicit uses of the Stefan-Boltzmann formula which are erroneous, and which cast doubt, not on the Greenhouse effect, but on the null result here.
We will try to answer his criticism and add more of the experimental details that he requests. But let us first make a summary of the experiment.
The experiment
The purpose of the simulated earth/atmosphere experiment was to a) be able to measure IR radiation, b) to reduce thermal energy losses to the surroundings and c) to measure temperature more accurately.
The experimental setup is shown in Figure 1: The front camber was added in order to separate the CO2 gas from the air in the rear chamber. This reduces heat loss from the rear chamber through the two windows due to heat conduction.


The one meter long, 50 cm wide and 30 cm high box, with a volume of 150 liters, is made of insulating 5 cm thick Styrofoam plates. The two chambers are separated by a 0.03 mm thin transparent plastic film. The window in the front of the box was also made from this film. The inner walls of the chambers (except the rear wall) are covered by thin, polished Al-foil. The Al-foil reflects most of the IR radiation and thereby reduces the heat loss through the walls. The length of the rear and front chamber is 30 and 70 cm, respectively. IR radiation was produced by heating a black-painted metal plate (or a thin, black painted Al-foil) to 100 oC by a 500W halogen lamp. A thermometer, measuring the gas temperature, was placed close to the roof in each chamber and screened from direct radiation from the heating plate.
An IR radiation detector is located in front of the window on the box (IR1). Another detector is placed behind the box (IR2) and measures IR backscatter radiation via a 6×6 cm window in the rear wall. To measure the heating of the inside of the rear Styrofoam wall with high accuracy, eight serial-connected and black-painted thermocouples was placed on the rear wall.
To avoid local convection and temperature gradients in the two chambers, a small fan with reduced speed is placed in each chamber. Energy input to the fans was small, only 0.6 watts. Since the gas expands during heating, each chamber has a small 5 mm aperture (covered with a piece of plastic) in the “roof” to avoid increasing the pressure. To check if infiltration from the surrounding air changes the amount of CO2 in the front, the CO2 level was inspected after the experiment. The chamber was still filled with CO2.
Construction, calibration and use of the IR sensors
To measure IR radiation and the backscatter generated by CO2, we constructed two IR detectors, using wide-band (3 to 24 μm) thermopile circuits with a nearly flat frequency response.
Calibration: To obtain a radiation spectrum close to that of a black radiator, we used a black iron pan, filled with water of temperature of 100 oC and allowed the temperature to fall to 15 oC. The measured relationship between the temperature of the radiating source and the output of the detector (in mV), is shown in Figure 2:


We see that the relationship is non-linear, not linear as expected from the Seebeck effect. Instead, we find that the voltage response depends linearly on the energy density of the radiation from the IR source. We computed the IR energy density output E (W/m2) from the pan, using the equation E = σT4 (the Stefan-Boltzmann’s law) where σ = 5.67 *10-8 W/(m2K4) and T is the temperature in Kelvin. The result is shown in Figure 3.

Getting a linear relationship supports the assumption that we can use the S-B equation to quantify IR radiation with the detector. But the reviewer pointed out that the IR source is not a perfect black body, and the emitted IR radiation might then be slightly lower than indicated by the S-B law (probably reduced by ca. 5%).
The reviewer also pointed out that there was a voltage offset of ca 20 – 30 mV in the detector circuit output. This offset is very small, compared to the operating range of the IR detector of more than ± 5 volts. The circuit used is a well-known one, f. inst. suggested by Hamamatsu.
The reviewer writes: “The sensor contains in addition to a thermopile, a highly accurate negative temperature coefficient (NTC) thermistor to aid in building a temperature compensation circuit”.
We were warned against combining the NTC and the thermopile circuit to compensate for variation in device temperature. It is much better to make separate circuits for the thermopile and then do the temperature correction in the computing procedure.
FOV (field of view)
The FOV of the detector is shown in Figure 4. A common way of defining the FOV is to use the half-angle, i.e. the value where the sensitivity is reduced to 50% of the maximum value. Figure 4 shows that the half-angle is close to ±5 degrees. At ±10 degrees ca 98% of the FOV is included.
With the length of one meter of the box the detector IR1 “sees” a circular area with a diameter of 35 cm, covering the heating plate and most of the rear wall. When the detector is placed in front of the window it then “sees” a 35 cm circular area of the 30 x 50 cm rear wall. The complete metal plate is “seen” within the half-angle FOV.
When the detector IR2 is measuring IR radiation from the interior of the box, it mainly “sees” the front chamber where the heated gas and windows radiates. The radiation is homogenously distributed across the two chambers, so the measurement situation is similar to that used during calibration.


As the reviewer points out the IR1 detector “sees” more than the heating plate, but the plate covers the main part of what the FOV measures.
Temperature measurements
The temperature increase in the two chambers during heating was equal (within the measuring accuracy) with air or CO2 in the front chamber. See figure 5. This is the most important result in our study.


The reviewer seems to misinterpret Figure 5:
“This experiment is now repeated with the front compartment filled with 100% CO2. Now emitted IR radiation from the aluminum plate is partially absorbed by CO2 raising the temperature of the front compartment to around 33C. This causes radiation passing through the front window to drop temporarily”.
This is definitely not what we say. The back chamber heats up from 20 oC to 46 oC (upper two curves) and in the front chamber from 20 oC to 32 oC (lower two curves). The point is that the curves are identical for plain air and for 100% CO2 in the front chamber. This was surprising to us, since NASA (and Al Gore) claimed that we should have extra warming from 100% CO2. Also, the radiation passing through the front window does not drop temporarily but approaches a constant value. See figure 6.
“The missing IR is presumed to be redirected or reflected toward the rear compartment”.
We measure, not presume, that CO2 IR radiation is redirected or reflected toward the rear compartment.
IR measurements
The IR1 detector measured reduced IR output through the front window with CO2 in the front chamber.

Figure 6. Absorption of IR radiation. Range: 2.5 – 20 µm. Heating is done with the Al-plate.
The detector is pointing at the center of the 100 oC heating plate. With CO2 in the front chamber the IR radiation decreased 29.8 W/m2 or ca 10%. This is close to what we find from the HITRAN data-base, i.e. 11.6% for a 70 cm long tube. The slightly lower measured IR walue might be due to the fact that the detector FOV is slightly larger than the heating plate. Anyway, an error of a few % will not influence our results and conclusions in any significant way.
To find how much IR radiation is leaving trough the front window, we need to know how much it varies at different positions. For this we used a thermopile detector without a lens, giving it a wide FOV. The detector was used to measure IR output along the 50 cm wide front window. The spectral sensitivity is a narrow band in the 4 μm region where CO2 absorbs/emits IR radiation. The result is found in figure 7, showing that the output is close to constant, with roughly ±4 % variation.


The IR2 detector measured increased IR radiation hitting the rear wall with CO2 in the front chamber. See figure 8.


Figure 8. Backscatter (increased IR radiation measured by IR2), received by the rear wall of the box, increased 17 W/m2 with CO2 in the front box. Heating is done with the Al-foil.
The IR2 detector “sees” mainly the IR reflected from the two windows and the gas within the two chambers. The distribution of reflected IR is relatively homogenously distributed in the chambers, verified by figure 7. The measurement situation is therefore not very different from that used to calibrate the detector.
The reviewer have some objections:
“When the apparatus is in operation the aluminum plate at 100C radiates IR and causes the rear compartment to reach a steady temperature of about 46C. The authors “compute” the irradiance of the back surface using the Stefan-Boltzmann law. When the front compartment is filled with air all of this “computed” IR power is supposed to exit the front window”.
What we do: We use the calibrated IR detector IR1 to measure the amount of IR leaving through the front window, with air and then with CO2 in the front chamber. We find that more IR energy is absorbed in the box with CO2 in the front chamber. We use the calibrated IR detector IR2 to measure the amount of IR hitting the rear wall. We find that more IR energy is received by the rear wall with CO2 in the front chamber.
Misuse of the Stefan-Boltzmanns law?
Review comment:
“The apparatus here is not a cavity. It is transparent on one end and partially so on the other. Having a substantial fraction of its surface transparent means that placement of materials and their detailed radiation characteristics matter.[2] The first order of approximation to IR radiation from something that is not a cavity, and not isothermal, is to use the Stefan-Boltzmann law, but to assign appropriate emissivities less than 1.0 to different materials. The blackened aluminum radiator has an emissivity close to 1.0. It is perhaps 0.96, but the bare Styrofoam is far from black at IR wavelengths. An accepted estimate of emissivity of this material is 0.60; i.e. at any temperature it will radiate only 60% as strongly as the Stefan-Boltzmann law predicts”.
The reviewer states that we must include the emissivity ε in the S-B equation to get the correct relationship between temperature T and IR energy flow E:
E = εσT4
We are in an advantageous situation since we can measure the IR radiation and the temperature of Styrofoam when it is heated! This was done and we found that, in our experimental setup, the value of ε was measured to be 1.0 ± 0.025, not 0.6! So maybe the chambers behave a bit like a cavity after all… This result also negates the criticism of using the S-B equation in the calibration procedure.
Energy balance
Under Energy balance the reviewer claims that we have energy loss. Yes, of course. The radiation and thermal energy is flowing from the back wall through the front window (like IR from the earth surface to the space). After 30 minutes a close to steady state was established. IR energy from CO2 in the front chamber is partly lost through the front window, partly returned to the rear chamber. The point is that we do not observe any extra warming in the rear chamber despite of the increased level of IR radiation measured there. This is why we say that the back scatter heating theory might be wrong.
Energy content in gases
The reviewer presents an alternative theory:
“An atmosphere containing 70 cm of 100% CO2 at a pressure of 100kPa has effective emissivity of about 14%. Once this gas absorbs its limit of 14% of IR from the back compartment (i.e. 14% of 80 watts) and reaches an equilibrium temperature it does not reradiate this backward, but rather in all directions. It is reflected many times from the aluminum foil, with 4% being absorbed with each reflection, some passes out the front EDTA window, some passes the intermediate EDTA window and reaches the rear compartment. This could easily be only 10% of what had been absorbed in the front compartment”.
It seems that the reviewer believes that the energy just disappears through the walls and windows. He suggests that only 10 % of the energy flow that has been absorbed by CO2 in the front chamber reaches the rear compartment, which is ca 2W/m2 of 20W/m2. However, we measure an increased energy flow of 17 W/m2, not 2W/m2, returned to the rear chamber,
“The gas in the rear compartment contains so little CO2 that its emissivity (which equals its absorptivity) is probably in the neighborhood of only 1%. Thus, the null result of this experiment, rather than being a surprise, should be entirely expected”.
It is correct that the air (as well as the windows) absorbs (and emit) IR radiation, but the absorption in air is much larger than 1%. This was tested by us in a 30 cm long box Styrofoam box with a single window. The IR emission from the air in the box increased linearly with temperature in the 15 – 35 oC range. The increase of IR emitted by the air was significant, about 30% of the increased radiation from the Styrofoam walls. (The relative humidity of the air was ca 30 – 35%).
By measuring IR emission with/without the window we found that roughly 30% of the increase in the measured IR was emitted by the window. Since the temperature of the windows are the same with air and CO2, the IR contribution from them are also equal.
In Figure 8 the amount of IR radiation emitted back to the rear wall is shown, with air in both chambers (black circles). This is IR radiation received from the heated air and the heated windows. The measured IR increment is ca 65 W/m2, while the increase with CO2 in the front chamber is 17 W/m2, or an increase of about 25%. The radiation absorbed by the air is re-emitted in all directions and reflected by the Al-foil walls, with some absorption. By adding CO2 in the front chamber, less of the IR from the heating plate leaves the box through the front window. The IR2 detector shows that the IR level inside the rear chamber increases significantly, and remains high!
A final critical review comment:
“One additional error in applying the Stefan-Boltzmann law occurs in the translation of the calibration transfer function to an irradiance value. The calculation mentioned in the quotation about the calibration procedure implies a one-way transfer from the blackened pan to the sensor, when in fact the transfer is two way between the sensor and pan”.
Theoretically this could lead to an error, but it is too small to be measurable. The pan, filled with water, weighs 7 kilo, while the small detector weights ca 200 grams. It is placed only a few seconds in front of the pan and removed after the IR measurement is performed. The temperature of the detector is close to that of the surrounding room. The detector box is made of aluminum. When the measurements are done the box mainly reflects IR from the room, which is what the black pan “sees” between measurements!
Lessons learned
All of the reviewer´s statements about misuse of the S-B law has been rejected.
We were able to measure IR radiation with an accuracy of ±2.5 %.
IR backscatter from CO2 in the front chamber to the rear chamber does not increase the temperature of the rear wall and the air in the chamber, as assumed by the climate models.
via Watts Up With That?
May 15, 2021
Landmark study casts doubt on controversial theory linking melting Arctic to severe winter weather
By Paul Homewood
From GWPF:


Every time severe winter weather strikes the United States or Europe, reporters are fond of saying that global warming may be to blame. The paradox goes like this: As Arctic sea ice melts and the polar atmosphere warms, the swirling winds that confine cold Arctic air weaken, letting it spill farther south. But this idea, popularized a decade ago, has long faced skepticism from many atmospheric scientists, who found the proposed linkage unconvincing and saw little evidence of it in simulations of the climate.
Now, the most comprehensive modeling investigation into this link has delivered the heaviest blow yet: Even after the massive sea ice loss expected by midcentury, the polar jet stream will only weaken by tiny amounts—at most only 10% of its natural swings. And in today’s world, the influence of ice loss on winter weather is negligible, says James Screen, a climate scientist at the University of Exeter and co-leader of the investigation, which presented its results last month at the annual meeting of the European Geosciences Union. “To say the loss of sea ice has an effect over a particular extreme event, or even over the last 20 years, is a stretch.”
Full story
I wonder if the “Independent” will now retract their phony story from last month?


https://www.independent.co.uk/independentpremium/snow-april-europe-sea-ice-b1831247.html
Or if the BBC/Guardian will now print the truth?


via NOT A LOT OF PEOPLE KNOW THAT
May 15, 2021
I Dream of EV


A couple of weeks ago the BBC ran a story titled “Climate change: Electric trucks ‘can compete with diesel ones.’” My (admittedly knee-jerk) reaction was that it was obviously a load of nonsense. (The argument is that (counter-intuitively) by shrinking the size of the battery you improve the truck. That reduces the range but supposedly makes the truck more cost effective.) Anyway I reined myself in and thought: “Jit, you can’t just reject the idea out of hand, you have to read the paper the story is based on with an open mind.” So I went to the journal “Joule” but couldn’t access the paper. Then I went to Google Scholar but couldn’t even find the paper. Instead I stumbled across an article called Electric Vehicles and Psychology by Fabio Viola*, lately published in the journal Sustainability. So I began to read that instead. What follows is a brief review.
1. Introduction
Car owners, Viola says, fret about the reduced range of an EV over a good old-fashioned diesel. What psychological tricks can be used to speed up the adoption of EVs? The plan to ban engines had
“…already put the comics industry in crisis, which has not yet found a single onomatopoeia for the noise of the cars. “Brooomm,” “Drooow,” “Vroom,” and “Roammm” are the standard noises, but now we will have to find something more significant than “Zzzz!”. The matter is serious. To solve the problem, the iconic German manufacturer of Bayerische Motoren Werke (BMW) performance machines asked for the help of one of the greatest modern composers of movie soundtracks, Hans Florian Zimmer, to create a sound of electric cars worthy of the ICE sisters.”
Yes, that Hans Zimmer^. But there was more. The weedy sound of a Porsche EV could be enhanced by artificially-generated grunt.
“The same philosophy [generating artificial noise for an EV] has been adopted by Porsche in its Taycan luxury electric sports car. The buyer can, in fact, decide to add the Electric Sport Sound to his car, an optional item with a cost of EUR 500, which adds a real soundtrack, both inside and outside the car.”
By soundtrack I don’t think he means REO Speedwagon. An alert is required under EU law, but car makers don’t want people to notice that their car merely exists. They want people to notice that their car is Rarrrghh.
“If the reader is looking for simple answers, the author does not recommend reading the subsequent sections, as few paradoxes are solved.”
Naturally I read on.
2. Finding Early Adopters
Where new tech is concerned you can either be an Innovator, an Early Adopter, in the Early Majority, in the Late Majority, or you can be a Laggard. I’m in the last group, which has to be dragged kicking and screaming to the EV shop:
“The descriptor says it all! Typically, they prefer traditional ICE and will adopt new EVs when there are no alternatives. Laggards are convinced of machinations and have their own ideas on everything, often supported by pseudoscientific reasoning.”
Well, we’ll see. The important people are apparently the second lot, the Early Adopters, the opinion formers, the YouTubers, Instagrammers, etc. There is seemingly a “chasm” between the Early Adopters and the third group, the Early Majority, into which some innovations fall, never to be seen again (possibly the Sinclair C5 did not manage to power itself far enough upslope to even reach the precipice, and the Thingummywig must have crawled into a drain before the Instagrammers latched onto it, or before it latched onto them, face-hugger style). Anyway we need the shiny Early Adopters to cajole, encourage, and generally harass the rest of us into jumping on the EV bandwagon.
3. Chicken or egg paradox
This particular paradox is no paradox at all for anyone who has heard of evolution, because the ancestors of chickens were egg-layers. This particular version of the paradox is that folk are reluctant to get an EV until the charging infrastructure is in place. But no company in their right mind would invest in infrastructure when there are no EVs to charge. Paradox!
According to Viola, the “hegemony of the present” dictates that we human car users want to drive, refuel, and carry on driving. It’s what we’re used to, but it is no good for the Anthropocene. If there was a fighting chance of that being possible for EVs, it could only be done with battery swapping. But that would make the battery less well protected, and we all know what might happen when an EV battery gets bashed (see later).
Viola then enthuses about the panaro, the basket that Italians used to lower down from their windows to receive deliveries of bread. The EV version of the panaro is a jungle of extension leads depending from the high windows of tower blocks down to the street below. Dangerous, but it encourages EV adoption, so it gets two thumbs up. I think the upshot here is that although most charging events will happen at home, the most important infrastructure is still the motorway chargers, so that we stop worrying about…
4. Range Anxiety
If you asked me what my principal objection to EVs was, it might be range anxiety. It might also be that I don’t have a driveway, or that an EV costs more than a normal car, except second hand, when it goes for so little that the only conclusion is that the battery must be shot.
“By range anxiety we mean the anxiety of not succeeding, not reaching the goal, an anxiety of performance.”
This particular anxiety cannot be cured by a rhombus-shaped blue pill. Because the battery is the weak point, we overlook all the good things about EVs. Like the Zimmer soundtrack fitted as standard. Here Viola goes into an interesting aside about the way cars with an internal combustion engine displaced EVs, horses, shanks’s pony, etc, in the early 20th century. Initially EVs were better than petrol cars owing to the lack of reliability of the latter. Then the petrol cars started coming off a moving production line, their power increased by an order of magnitude, they were cheaper… and EVs were just too damn gendered. Men, it seemed, wanted grunt. EVs were not only gentle, they were simple to operate, so they were popular with the ladies (I am paraphrasing the history as given here, don’t shoot the messenger).
“…the limited range of EVs cooled the desire to undertake journeys into the wilderness.”
Where once we crossed the desert on a horse with no name, now we sallied forth in a Model T. Ford, Edison, Firestone and Burroughs went on camping trips, calling themselves The Vagabonds**. Naturally this was done in a convoy of petrol cars, not equines or EVs.
At its simplest, range anxiety happens when we have further to go than the dashboard tells us we can go. This is not usually a problem in a car with an engine that can be refuelled in 4 minutes and when there are petrol stations every 30 miles or so. Naturally when recharging takes a long time, it is preferable to do it at home, or at your destination. This makes abundant sense to me. But there’s a more insidious version of range anxiety, something to do with algae apparently:
“…a phycological anxiety arises “the distance to be traveled is below to [sic] the vehicle’s range, but users irrationally are worried about the possibility to finish the charge””
My apologies to Dr Viola, especially since his English is a hundred times better than my Italian, which is limited to “Ciao, bella!” (probably redundant language these days, even in Italy) and a variety of cussing that I picked up from an actual Italian, but can’t repeat here.
There is though yet another form of range anxiety: rhetorical anxiety. Viola discusses at length Hirschman’s The Rhetoric of Reaction: Perversity, Futility, Jeopardy as it applies to EV adoption. Intransigents, or conservatives, are opposed to innovation, but for irrational reasons. The first excuse we trot out for our knee-jerk opposition is the Perversity of the entire project: EVs are charged by fossil fuel anyway, so what is the point? Second, we cry Futility! Buying an EV won’t change the world, so why the hell should we bother? Third, EVs place us in Jeopardy. They are too expensive: we don’t want to burn money on an EV when we could be spending it on something particularly appealing to intransigents, bills for example. Jeopardy also comes into play with range anxiety, because we fear conking out in the middle of nowhere. All these objections seem perfectly rational to me.
But wait. There’s something we’ve forgotten. Most of our trips are actually quite short, so at least our fears re: conking out are groundless! Hm, yes, but if I want to drive to a city 200 miles away a few times a year, what am I going to do? Drive all that way, pull up in the hotel car park on my last electron, and find that the two chargers are both occupied?
Apparently we intransigents are naught but foxes, who declare that the out-of-reach grapes are unripe. That’s a reference to a fable I don’t quite grok. I mean, if the fox declared that some out of reach hens were unripe, or better overripe, a bit too stringy for his taste, I could see it. But how many foxes eat grapes, even if they’re ripe?
5. Things that go boom in the night (actually this section is called “My Cousin Told Me EVs Explode…”)
Here Viola argues that any crash that would cause an EV to auto-incinerate and cremate its occupants would be severe enough that the occupants would be dead anyway before they were burned to ash. So that’s all right then. EVs are a neat little self-extracting ACME funeral service machine if you crash them hard enough. They leave nothing unpleasant for the emergency services to clear up afterwards.
6. Viking Men Paradox
“(about Tesla) It’s a real housewives’ car. You can put all the groceries in the back, and your handbag between the seats in front. If you haven’t bought the stupid centre console, you can do that, at least. That’s what women wanted: a place to put their bag.”
I think that was a comment by a Viking Man. Men Want Big Truck. Women Want Handbag Place. Or something.
7. Autonomous Silver Vehicles
Crusties are going to be zooming around in robot EVs, statim. I mean the elderly are naturally going to gravitate towards these things, because they want to knit as they go, or they can’t see very well, or something, all very demeaning non-reasons which I reject out of hand.
8. Marriage or Cohabitation?
Don’t have an arranged marriage with your EV. Shack up with it first, and you will grow to love it. Then you can marry it. Try one and you will be pleasantly surprised.
9. Conclusions
“The advent of Tesla connected the male and female worlds: for enthusiastic males, the Tesla was a technological advancement akin to that from a Nintendo Entertainment System (1983) to a PlayStation 3 (2006), while for enthusiastic women, it was a refined place to put the handbag.”
Unfortunately for EV enthusiasts, finding psychological ploys, or even phycological ploys, to make people believe that EVs beat cars with an engine relies on a healthy dose of petitio principii. The assumption made is that EVs are better, and that resistance to them is therefore irrational. Well, I like to think of myself as rational, and I also like to think of myself as a very small part of the resistance. If I ever have an EV, it will be because the fuel duty/VED of petrol cars has become so punishing that they have been completely driven off the road. Or maybe dragged off the road. Or maybe left on the side of the road to rust into millions of sad little heaps. And as an intransigent, even if I can’t drive a petrol car any more, I might just walk instead, and sneer impotently in the direction of that BMW whizzing past with its Zimmer soundtrack blaring out.
REFERENCES
^ Perhaps in embarrassment, BMW have deleted the story about Hans Zimmer’s soundtrack for their EVs, so you have to go to Archive.org to find it.
via Climate Scepticism
May 15, 2021
New NASA data sheds (Sun) light on climate models


Scientists at the University of Michigan, NASA’s Goddard Space Flight Center in Greenbelt, Maryland, and University of Colorado Boulder recently used TSIS-1 SSI satellite data in a global climate model for the first time – and got a few surprises. Another dent in the myth of ‘settled’ climate science.
– – –
Have you ever worn a dark T-shirt on a sunny day and felt the fabric warm in the Sun’s rays? asks NASA-GISS.
Most of us know dark colors absorb sunlight and light colors reflect it – but did you know this doesn’t work the same way in the Sun’s non-visible wavelengths?
The Sun is Earth’s power source, and it emits energy as visible sunlight, ultraviolet radiation (shorter wavelengths), and near-infrared radiation, which we feel as heat (longer wavelengths).
Visible light reflects off light-colored surfaces like snow and ice, while darker surfaces like forests or oceans absorb it. This reflectivity, called albedo, is one key way Earth regulates its temperature – if Earth absorbs more energy than it reflects, it gets warmer, and if it reflects more than it absorbs, it gets cooler.
The picture becomes more complicated when scientists bring the other wavelengths into the mix. In the near-infrared part of the spectrum, surfaces like ice and snow are not reflective – in fact, they absorb near-infrared light in much the same way a dark T-shirt absorbs visible light.
“People think snow is reflective. It’s so shiny,” said Gavin Schmidt, director of NASA’s Goddard Institute for Space Studies in New York City and acting NASA senior climate adviser. “But it turns out in the near-infrared part of the spectrum, it’s almost black.”
Clearly, for climate scientists to get the whole picture of how solar energy enters and exits the Earth system, they need to include other wavelengths besides visible light.
That’s where NASA’s Total and Spectral Solar Irradiance Sensor (TSIS-1) comes in. From its vantage point aboard the International Space Station, TSIS-1 measures not only the total solar irradiance (energy) that reaches Earth’s atmosphere, but also how much energy comes in at each wavelength.
This measurement is called spectral solar irradiance, or SSI. TSIS-1’s Spectral Irradiance Monitor (SIM) instrument, developed by the University of Colorado Boulder’s Laboratory for Atmospheric and Space Physics, measures SSI with an accuracy better than 0.2%, or within 99.8% of the true SSI values.
“With TSIS-1, we have more confidence in the measurements of visible and near-infrared light,” said Dr. Xianglei Huang, professor in the department of Climate and Space Sciences and Engineering at the University of Michigan. “How you partition the amount of energy at each wavelength has implications for the mean climate.”
Full article here.
via Tallbloke’s Talkshop
May 15, 2021
Klimawahl 2021? Die unterschätzte Macht des Grünen Lobbyismus


Führende Umweltorganisationen wollen die Bundestagswahl 2021 zur Klimawahl ausrufen.
Derweil stellen Analysten fest, dass grüne Lobbyisten unterschätzt werden.
Dabei hätten viele Umweltverbände in entscheidenden Fragen längst größeren Einfluss als die oft beschworene ‚Wirtschaftslobby‘, inszenierten sich aber bis heute weiter als kleine Bürgerinitiativen, die gegen eine übermächtige Industrie kämpfen würden.

NASA: Why does the Sun Matter for Earth’s Energy Budget?


Earth’s energy budget is a metaphor for the delicate equilibrium between energy received from the Sun versus energy radiated back out in to space.
Research into precise details of Earth’s energy budget is vital for understanding how the planet’s climate may be changing, as well as variabilities in solar energy output.
Missions like NASA’s TSIS will help scientists keep a close watch.
NASA’s Total and Spectral Solar Irradiance Sensor, or TSIS-1, is a mission to measure the sun’s energy input to Earth.
Various satellites have captured a continuous record of this solar energy input since 1978. TSIS-1 sensors advance previous measurements, enabling scientists to study the sun’s natural influence on Earth’s ozone layer, atmospheric circulation, clouds, and ecosystems.
These observations are essential for a scientific understanding of the effects of solar variability on the Earth system.
NASA Goddard Space Flight Center manages the project. The University of Colorado’s Laboratory for Atmospheric and Space Physics (LASP) built both instruments and provides mission operations. The International Space Station carries TSIS-1.

This video is public domain and along with other supporting visualizations can be downloaded from the Scientific Visualization Studio at: