
Daily Archives: 10. May 2021
Japan region seeing uptick in earthquake activity, Earthquake update.. Viewer shout-outs 5/10/2021

Comet’s death dive into Sun captured by spacecraft

EXPLOSIVE Lava Pool of Geldingidilar Volcano In Iceland Is Absolutely AMAZING To See 👀❤️

HUGE lava fountain. Biggest so far? 500 meters?

Healthcare Communication Relay
This is an unsolicited backup of an article by Doctors for COVID Ethics, published on April 30, 2021, and removed by its host Medium a few days later.
COVID Vaccines: Necessity, Efficacy and Safety
Abstract
COVID-19 vaccine manufacturers have been exempted from legal liability for vaccine-induced harm. It is therefore in the interests of all those authorising, enforcing and administering COVID-19 vaccinations to understand the evidence regarding the risks and benefits of these vaccines, since liability for harm will fall on them.
In short, the available evidence and science indicate that COVID-19 vaccines are unnecessary, ineffective and unsafe.
Necessity: Immunocompetent individuals are protected against SARS-CoV-2 by cellular immunity. Vaccinating low-risk groups is therefore unnecessary. For immunocompromised individuals who do fall ill with COVID-19 there is a range of medical treatments that have been proven safe and effective. Vaccinating the vulnerable is therefore equally unnecessary. Both immunocompetent and vulnerable groups are better protected against variants of SARS-CoV-2 by naturally acquired immunity and by medication than by vaccination.
Continue reading the archived version. If it is not available, try this one.


This backup serves as a message relay. It does not imply endorsement.
The article was deleted by the Medium with the message: ERROR 410
This post is under investigation or was found in violation of the Medium Rules.
via Science Defies Politics
May 10, 2021
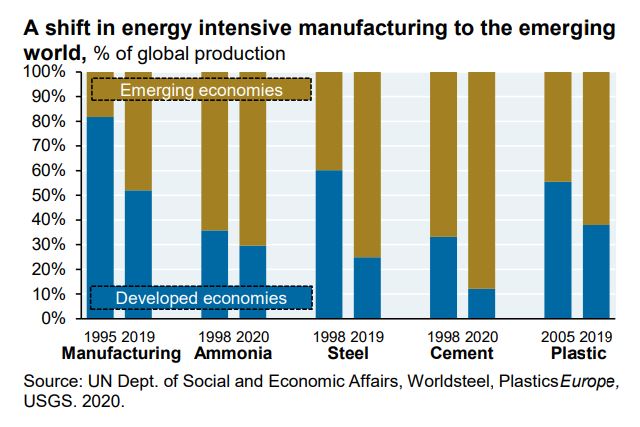
If an adversary wanted to destroy manufacturing they could hardly have done a better job
The Western World has mostly succeeded in reducing emissions by shifting their emissions to factories in developing nations. In industries like Steel, Cement and Plastic as much as 20 – 50% of all production has gone overseas.
All this was achieved in just 20 years or so…


In the game of emissions reductions the West will become irrelevant (and in so many other ways too):
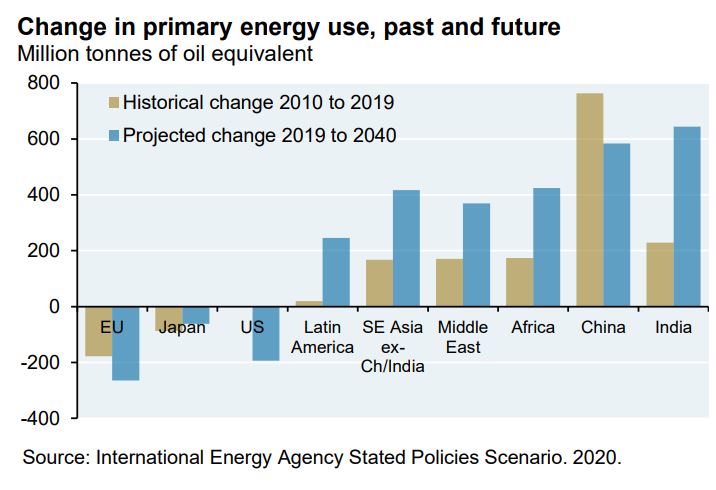
…The even more important and larger question: even if the US succeeds, what about everyone else? Over the last 25 years, the developed world shifted much of its carbon-intensive manufacturing of steel, cement, ammonia and plastics to the developing world. As a result, developing world adoption of wind, solar, storage and nuclear power may end up being the primary determinant of future global emissions outcomes. That has certainly been the case over the last decade: Europe and Japan reduced primary energy use by 4%-6% but developing world increases were 6x higher than their reductions
–Michael Cembalist, JP Morgan Annual Energy Paper
It’s only a projection .


After the Legacy Media, comes the Legacy Superpower.
REFERENCES
-Michael Cembalest, JPMorgan, 2021 Energy Review
h/t Thanks to Rafe Champion at Catalaxy and Old Ozzie.
via JoNova
May 10, 2021
Climate Change Thinking for Open or Locked-Down Minds

William Happer provides a framework for thinking about climate, based on his expertise regarding atmospheric radiation (the “greenhouse” mechanism). But he uses plain language accessible to all. The Independent Institute published the transcript for those like myself who prefer reading for full comprehension. Source: How to Think about Climate Change Some excerpted highlights in italics with my bolds,


This presentation by Dr. William Happer was delivered at the Hillsdale College National Leadership Seminar in Phoenix, Arizona, that was held on February 19, 2021. The Cyrus Fogg Brackett Professor Emeritus of Physics at Princeton University, Dr. Happer is the author of the foreword to the Revised and Expanded Third Edition of the Independent Institute book, Hot Talk, Cold Science: Global Warming’s Unfinished Debate, by S. Fred Singer, David R. Legates and Anthony R. Lupo.


The Climate Crusade for a False Alarm
The best way to think about the frenzy over climate is to consider it a modern version of the medieval Crusades. You may remember that the motto of the crusaders was “Deus vult!”, “God wills it!” It is hard to pick a better virtue-signaling slogan than that. Most climate enthusiasts have not gone so far, but some actually claim that they are doing God’s work. After decades of propaganda, many Americans, perhaps including some of you here today, think there really is a climate emergency. Those who think that way, in many cases, mean very well. But they have been misled. As a scientist who actually knows a lot about climate (and I set up many of our climate research centers when I was at the Department of Energy in the early 1990s) I can assure you that there is no climate emergency. There will not be a climate emergency. Crusades have always ended badly. They have brought discredit to the supposed righteous cause. They have brought hardship and death to multitudes. Policies to address this phony climate emergency will cause great damage to American citizens and to their environment.
Part of the medieval crusades was against the supposed threat to the holy sites in Jerusalem. But a lot of it was against local enemies. The medieval Inquisition really did a job on the poor Cathars, on the Waldensians of southern France, and on the Bogomils in the Balkans. Climate fanatics don’t know or care any more about the science of climate than those medieval Inquisitors knew or cared about the teachings of Christ.

Don’t Confuse CO2 with Air Pollution
Just about everyone wants to live in a clean environment. I do, and I am sure everyone here does. This is a photograph of Shanghai, and that’s real air pollution. You can just barely see the Bottle Opener Building in the back through all the haze. Some of this is due to burning coal. But a bigger fraction is due to dust from the Gobi Desert. They have had this type of pollution in Shanghai since the days of Marco Polo and long before. Part of it is burning stubble of the rice fields, which is traditionally done before planting next year’s crop. This is real pollution. I would not want to live in a city like that. If there is anything to do that would make it better, I would certainly support that.
But, none of this has anything to do with CO2. CO2 is a gas you cannot see, smell or taste. So, hare-brained schemes to limit emissions of CO2, which is actually beneficial, as I will explain a little bit later, will only make it harder to get rid of real pollutants like what I just showed you in Shanghai.


Like all wind farms it is now falling to pieces we can’t dispose of.
Renewable energy is what I would call the inverse Robin Hood strategy—you rob from the poor to give to the rich. Utilities are permitted to raise rates because of their capital investments in inefficient, unreliable renewables. They junk fully depreciated coal, gas and nuclear plants, all of which are working beautifully, and producing inexpensive, reliable energy. But regulated profits are much less. Taxpayers subsidize the rich, who can afford to lease land for wind and solar farms. Tax incentives pander to the upper class who live in gated communities and can afford to buy Tesla electric cars. They get subsidies from the state and federal government. They even get subsidized electrical power to charge up their toys. The common people have little spare income for virtue signaling. They pay more and more for the necessities of life in order to subsidize their betters.
Climate Facts to Replace Hysteria
You cannot spend a lifetime as a professor and not relapse from time to time into giving a classroom lecture. So, you will have to expect to be lectured for a few minutes. The good news is that there will be no quiz. But for those of you who share my view that this climate hysteria is serious nonsense, it helps to know what the facts are. I hope I can arm some of you with the real scientific facts.

Climate involves a complicated interplay of the sunlight that warms us, and thermal infra-radiation that escapes to space. Heat is transported from the tropics to the poles by the motion of warm air and ocean water. We all know about the Gulf Stream that carries huge amounts of heat to northern Europe, even to Russia. Movements of air in the atmosphere also carry a lot of heat, as we know from regular cold spells and hot spells.

Here is a picture of Earth’s energy budget. I mentioned we are warmed by the Sun. About half of the sunlight eventually gets to the surface. What prevents it all from reaching the surface are clouds and a small amount of scattering and absorption by the atmosphere. Other parts of America, like New Jersey, now are covered with clouds. Those areas do not get any sunlight directly. But the half of sunlight that does reach the ground heats it. You can notice that in the afternoon, if you go outside. If you are a gardener like me, you can put your hands in the soil and it is nice and warm. It makes the corn grow. But that heat has to be released. If you keep adding heat to the ground, it gets hotter and hotter. So, the heat is eventually released by radiation into space which is that red arrow going up on the viewgraph. But for the first few kilometers of altitude, a good fraction of that heat is not carried by radiation, but by convection of warm, moist air. CO2 has no direct effect on convection near the surface. But once you get up to 10 kilometers or so, most of the heat is transported by radiation.
By the way, I have the meter running now. Remember that the outside air is 400 parts per million CO2. I am not sure you can see the meter but I will read it for you. It is 580 in here. It is not a whole lot higher than the 400 outside. It was at 1,000 parts per million where we were having lunch. CO2 levels are never stable near Earth’s surface. People are panicking about one or two parts per million of CO2. Now, the meter reads 608 parts per million—that is probably because I breathed on it. Hot air sets it off. I sometimes take the meter out onto my back porch. At the end of a summer day the CO2 levels on my back porch drop to maybe 300 parts per million, way below the average for outside air. That is because the trees and grass in my backyard have sucked most of the CO2 out of the local air during the day. If I get up early the next morning and I look at the meter, it is up to 600 parts per million. So just from morning to night CO2 doubles in the air of my back yard. Doubles and halves, doubles and halves. At least during the growing season that is quite common. And we have these hysterics about CO2 increasing by 30 or 40 percent. It is amazing.

So, why the frenzy over CO2? It is because it is a greenhouse gas. That is true. This is a somewhat deceptive picture. What it shows in red is sunlight, and the horizontal scale on the top panel is the wavelength of the sunlight. Radiation wavelengths for sunlight are typically about a half a micron (half a millionth of a meter). That is green light, the color of green leaves. The thermal radiation that cools the Earth is that blue curve to the right of the upper panel, and that is a much longer wavelength, typically around 10 microns. So, the wavelength of thermal radiation is 10 to 20 times longer than the wavelengths of sunlight. It turns out that the sun’s energy can get through the Earth’s atmosphere very easily. So essentially all sunlight or at least 90 percent, if there are no clouds, gets to the surface and warms it. But radiation cooling of the surface is less efficient because various greenhouse gases (most importantly water vapor, which is shown as the third panel down, and CO2, which is the fourth panel down) intercept a lot of that radiation and keep it from freely escaping to space. This keeps Earth’s surface temperature warmer than it would be (by about 20 or 30 degrees). The Earth would be an ice cube if it were not for water vapor and CO2; and when I say water vapor, you should understand that I really mean water vapor and clouds, the condensed form of water. Clouds are at least as important as greenhouse gases and they are very poorly understood to this day.

This is an important slide. There is a lot of history here and so there are two historical pictures. The top picture is Max Planck, the great German physicist who discovered quantum mechanics. Amazingly, quantum mechanics got its start from greenhouse gas-physics and thermal radiation, just what we are talking about today. Most climate fanatics do not understand the basic physics. But Planck understood it very well and he was the first to show why the spectrum of radiation from warm bodies has the shape shown on this picture, to the left of Planck. Below is a smooth blue curve. The horizontal scale, left to right is the “spatial frequency” (wave peaks per cm) of thermal radiation. The vertical scale is the thermal power that is going out to space. If there were no greenhouse gases, the radiation going to space would be the area under the blue Planck curve. This would be the thermal radiation that balances the heating of Earth by sunlight.
In fact, you never observe the Planck curve if you look down from a satellite. We have lots of satellite measurements now. What you see is something that looks a lot like the black curve, with lots of jags and wiggles in it. That curve was first calculated by Karl Schwarzschild, whose picture is below Planck’s picture. Schwarzschild was an officer in the German army in World War I, and he did some of his most creative work in the trenches on the eastern front facing Russia. He found one of the first analytic solutions to Einstein’s general theory of relativity while he was there on the front lines. Alas, he died before he got home. The cause of death was not Russian bullets but an autoimmune disease. This was a real tragedy for science. Schwarzschild was the theorist who first figured out how the real Earth, including the greenhouse gases in its atmosphere, radiates to space. That is described by the jagged black line. The important point here is the red line. This is what Earth would radiate to space if you were to double the CO2 concentration from today’s value. Right in the middle of these curves, you can see a gap in spectrum. The gap is caused by CO2 absorbing radiation that would otherwise cool the Earth. If you double the amount of CO2, you don’t double the size of that gap. You just go from the black curve to the red curve, and you can barely see the difference. The gap hardly changes.
The message I want you to understand, which practically no one really understands, is that doubling CO2 makes almost no difference.
Doubling would replace the black curve by the red curve. On the basis of this, we are supposed to give up our liberties. We are supposed to give up the gasoline engines of our automobiles. We are supposed to accept dictatorial power by Bernie Sanders and Ocasio-Cortez, because of the difference between the red and the black curve. Do not let anyone convince you that that is a good bargain. It is a terrible bargain. The doubling actually does make a little difference. It decreases the radiation to space by about three watts per square meters. In comparison, the total radiation to space is about 300 watts per square meter.
So, it is a one percent effect—it is actually a little less than that, because that is with no clouds. Clouds make everything even less threatening.
Finally, let me point out that there is a green curve. That is what happens if you take all the CO2 out of the atmosphere. No one knows how to do that, thanks goodness, because plants would all die if you took all the CO2 out of the atmosphere. But what this curve is telling you is that the greenhouse effect of CO2 is already saturated. Saturation is a jargon term that means CO2 has done all the greenhouse warming it can easily do. Doubling CO2 does not make much difference. You could triple or quadruple CO2 concentrations, and it also would make little difference. The CO2 effects are strongly saturated.

You can take that tiny difference between those curves that I showed you, the red and the black curves, and calculate the warming that should happen. I was one of the first to do this: in 1982 I was a co-author of one of the first books on radiative effects of CO2. On the right panel is my calculation and lots of other people’s calculations since. It is a bar graph of the warming per decade that people have calculated. The red bar is what has actually been observed. On the right is warming per decade over 10 years, and on the left, over 20 years. In both cases the takeaway message is that predicted warmings, which so many people are frantic about, are all grossly larger than the observed warming, which is shown by the red bars. So, the observed warmings have been extremely small compared to computer calculations over any interval that you consider. Our policies are based on the models that you see here, models that do not work.
I believe we know why they do not work, but no one is willing to admit it.

Nobody knows how much of the warming observed over the past 50 years is due to CO2. There is good reason to that think much of it, perhaps most of it, would be there even without an increase in CO2 because we are coming out of the Little Ice Age. We have been coming out of that since the early 1800s, before which the weather was much colder than now. The green curve is measurements from satellites, very much like the measurements of a temporal scanning thermometer. You can look down from a satellite and measure the temperature of the atmosphere. The satellites and balloons agree with each other, and they do not agree with the computer models. This is very nice work by John Christie at the University of Alabama-Huntsville.
The alleged harm from CO2 is from warming, and the warming observed is much, much less than predictions. In fact, warming as small as we are observing is almost certainly beneficial. It gives slightly longer growing seasons. You can ripen crops a little bit further north than you could before. So, there is completely good news in terms of the temperature directly. But there is even better news. By standards of geological history, plants have been living in a CO2 famine during our current geological period.

This is the greening of the Earth measured from satellites. This picture shows areas of the Earth that are getting greener over the 20-year period. What you notice is that everywhere, especially in arid areas of Sahel (you can see that just south of the Sahara) it is greening dramatically. The western United States is greening, western Australia is greening, western India is greening. This is almost certainly due to CO2, and the reason this happens is that CO2 allows plants to grow where 50 years ago it was too dry. Plants are now needing less water to grow than they did 50 or 100 years before.

When you raise all these hard, scientific issues with the climate alarmists, the response is “how can you say that? 97 percent of scientists agree that there’s a terrible emergency here that we have to cope with.”
Here there are several things you should say. First of all, in science truth is not voted on. It is not like voting on a law. It is determined by how well your theory agrees with the observations and experiments. I just showed you that the theories of warming are grossly wrong. They are not even close and yet we are making our policy decisions based on computer models that do not work. It does not matter how many people say there is an emergency. If it does not agree with experiments and observations, the supposed scientific basis for the emergency is wrong. The claim of a climate emergency is definitely wrong.
Secondly, even when scientists agree, what they agree on can be wrong. People think of scientists as incorruptible, priestly people. They are not that at all. They have the same faults as everybody else, and they are frequently wrong.

The clincher actually came when the USA finally declassified the World War II North Atlantic Magnetic Anomaly data which we had been sitting on for 10 years. The data showed mirror-image conveyor belts of newly-formed oceanic crust, starting at the mid-Atlantic ridge and going out left and right toward America, and toward Europe. So, there was absolutely no question that the seafloor was spreading. That is the one bit of evidence that Wegner did not have, but he had lots of other evidence that should have persuaded people.
This is just one example. I could tell you about many other scientific consensuses that made no sense. This one is interesting because it had no political background. It was pure science, but it does illustrate the fallibility of scientists, and the group-think that goes on in science. If you wanted to advance as a young geologist you could write a paper scorning Wegner in 1950 and get promoted right away, even though your paper was completely wrong. And, once you get tenure, you are there for good.
So, the takeaway message is that policies that slow CO2 emissions are based on flawed computer models which exaggerate warming by factors of two or three, probably more. That is message number one. So, why do we give up our freedoms, why do we give up our automobiles, why do we give up a beefsteak because of this model that does not work?
Takeaway message number two is that if you really look into it, more CO2 actually benefits the world. So, why are we demonizing this beneficial molecule that is making plants grow better, that is giving us slightly less harsh winters, a slightly longer growing season? Why is that a pollutant? It is not a pollutant at all, and we should have the courage to do nothing about CO2 emissions. Nothing needs to be done.
via Science Matters
May 10, 2021 by Ron Clutz
Rising Carbon Prices Are Pushing Up Energy Bills
By Paul Homewood
Timera have just published a new analysis of European energy prices:


Carbon prices have hit 50 €/t. Winter 21 prices for German power are pushing 70 €/MWh. Winter prices for TTF gas are around 25 €/MWh (8.75 $/mmbtu), with JKM at 10.50 $/mmbtu. These levels reflect an explosive rally underway in the energy price complex.
We are going to keep it short and sweet this week and let one of our key charts do the talking.


Chart 1 shows the impact of surging carbon prices in pulling coal & lignite plant switching ranges higher. Rising switching levels are dragging up the TTF gas curve, pulling European power prices & Asian LNG prices higher with it.
The dynamics in play behind surging prices can be broken down into 4 main drivers.
1.Carbon prices
The single most important driver of higher European gas & power prices in 2021 is rising carbon prices. This is acting to pull both hard coal and lignite switching levels higher. Rising switching levels translate directly into higher European gas hub prices, with power prices following suit.
The higher the carbon price has risen, the more influential lignite switching has become. A 1 €/t move in the EUA price causes around a 0.45 €/MWh move in the lignite switching range compared to a 0.25 €/MWh for the coal switching range.
Chart 1 shows the front of the TTF curve sitting near the top of the lignite switching band. That means each €/t move higher is having almost double the impact on TTF vs the hard coal switching mechanism we are used to.
2.Russian & Norwegian supply
Europe’s two big pipeline gas suppliers are not responding to surging hub prices. European gas demand has been running at 5 year highs in 2021, so a lack of pipeline supply response is helping support prices.
Russian flows via the Ukraine route fell sharply into 2020 as the new transit agreement came into force. This drop also came against a backdrop of very low hub prices. Russian flows across this route started to rise again in Q4 2020 as TTF prices recovered, but have fallen back again in 2021.
Gazprom’s flow decisions are not a simple price / volume optimisation problem. A rapidly tightening European gas market is a convenient backdrop for Gazprom to apply political pressure on the EU (& Germany in particular), in order to ensure Nordstream 2 comes into operation.
Norwegian production has been relatively low in Q2 2021, with Norway engaging in major maintenance early this year. Production in the Netherlands is also ramping down fast with the giant Groningen field on track to close by mid 2022.
3.Asian LNG demand
Strong Asian LNG demand is important for European gas & power markets, as it results in the diversion of flexible LNG supply. This has been a theme of 2021 as Asian economic growth & gas demand recovers strongly, particularly in China.
After the fireworks of January 2021, Asian LNG demand cooled into March. But there is mounting evidence of a resurgence in Asian demand through the summer. The JKM forward price premium over TTF is rising, with netbacks for US LNG exports favouring flows to Asia. The time charter market is also tightening again (with rates back above 70k $/day), signalling a stronger pull for LNG from Asia.
European gas demand is strengthening against a backdrop of supply volume weakness across both pipeline and LNG imports.
4.European storage balance
European gas storage levels are low coming into the summer injection season. A blast of cold weather in April has seen aggregate storage inventories fall to around 30% full, versus 60% last year and a 40% 5yr average. Low Norwegian supply due to early maintenance has contributed to strong storage withdrawals.
These dynamics have caused an unusual shape in the TTF forward curve. May 21 has been pricing well above the summer months, reflecting an immediate demand for gas, prolonging the storage withdrawal season. Low storage inventory levels will support strong summer gas demand for injections to replenish stocks, another factor lifting the TTF curve.
Don’t get too tied up in the detail of the graph – it simply charts gas price trends.
But the key factor is the “coal switching range”. As gas prices rise, they eventually reach the point where it is cheaper to switch from gas power to coal power. And as carbon prices rise, that switching point also rises, because coal power is more carbon intensive and therefore attracts a higher carbon penalty.
As Timera explain, rising carbon prices this year, which are the direct consequence of EU policy, not only make coal power more expensive, but also encourage greater demand for gas. This, in turn, forces up gas market prices.
While Timera discuss other factors acting to push gas prices up, such as increased Asian demand, it is carbon pricing which is, and will remain, the most important driver.
This obviously has a knock on effect on UK gas and power prices. Catalyst Energy show below how fast UK wholesale power prices have risen this year.


https://www.catalyst-commercial.co.uk/works/may-2021-energy-market-brief/
OFGEM’s chart below shows the longer term trends, up to Dec 2020, indicating that current prices are probably now at record highs:


https://www.ofgem.gov.uk/data-portal/all-charts/policy-area/electricity-wholesale-markets
The sole intention of carbon prices, of course, is to make fossil fuel power more expensive than renewable energy. But it is energy consumers who will inevitably pay the cost.
via NOT A LOT OF PEOPLE KNOW THAT
May 10, 2021
$1000 / ton Carbon Tax? Climate Scientist Demands the Alleged Damage of Fossil Fuel be Fully Priced


Guest essay by Eric Worrall
Climate scientist David Lowe is horrified democratic governments like New Zealand are only charging double digit carbon prices – he thinks the true cost of carbon is around $1000 / ton, and should be imposed in a way which spans administrations.
Humans already have the tools to combat climate change but we lack leadership
In this extract, top atmospheric scientist Dave Lowe explains why despite political inaction he believes we can build a sustainable future
Dave Lowe
Mon 10 May 2021 06.00 AESTWhen it comes to the political will and leadership needed to drive the world towards a sustainable future, I’m a pessimist. Time and time again, I’ve heard rhetoric from politicians focusing on short-term goals at the expense of planning for the future. In 2021, the mainstream media promote responsible journalism and take a hard line with climate deniers. Many journalists hold governments to account over climate change goals. However, hard scientific data is often still manipulated and cherrypicked by politicians. I’ve spoken to many and liken the experience to walking through treacle.
Does their bland decision-making have to do with the structure of democracy itself, with its short electoral terms and lack of incentives for incumbent politicians to make hard and binding decisions for the decades ahead?
…
Crucial to the urgent transition towards a low carbon future will be the skills and experience of engineers. Over the years I’ve spoken to many groups of engineers, including oil and gas engineers, about climate change. You’d think that a climate scientist talking to a gas engineer would lead to an argument, but that has not been my experience.
…
Their skills are transferable to an economy making widescale use of “green hydrogen”, for example. Green hydrogen, produced by electrolysis of water using excess electricity derived from wind and other renewable energy sources, is already being used in steelmaking, energy storage and transport in Germany and a number of other countries.
…
If you ask a chemist how, and how much it would cost, to remove a tonne of CO2 from the atmosphere, they would probably throw up their hands in horror, come up with a figure of NZ$1,000 per tonne and a very complex apparatus. A climate scientist would reply to the question with another, like, “How much do you think the 2020 wildfires in Australia, California, Colorado, Siberia and the Arctic cost?” And a New Zealand economist would quote the current carbon price on the New Zealand emissions trading scheme site, which in early 2021 was about NZ$37 per tonne. To me that sounds ridiculously cheap, measuring in crude economic terms the cost of the damage by carbon emissions into our only atmosphere.
…
Read more: https://www.theguardian.com/world/2021/may/10/humans-already-have-the-tools-to-combat-climate-change-but-we-lack-leadership
Here’s a thought Dave. Why don’t you put your money where your mouth is?
Instead of pontificating about how we should all be paying $1000 / ton, why don’t you lead by example, and start a project where climate believers can pay you $1000 to physically remove a ton of carbon from the atmosphere?
Chemical extraction of CO2 from air is simple, not complicated, as you suggested. All you need to extract CO2 from air is to bubble air through a big tank of saturated lime water.
Calcium hydroxide (garden lime) is slightly soluble in water, but calcium carbonate (limestone) will precipitate and drop to the bottom of your tank. This process has been used for centuries to assay the CO2 content of a stream of gas, it is even taught in schools as a basic chemistry experiment – students blow into a tube, and watch clouds of calcium carbonate appear in the bottle they are blowing air into. Lime water is very good at grabbing CO2 out of the air, or out of people’s breath.
Of course, lime production is a very carbon intensive process, so you really need to recycle your calcium carbonate precipitate. Part of your CO2 recovery process should involve regenerating the lime from the precipitated calcium carbonate in a solar furnace, and disposing of the concentrated CO2 recovered from the regenerator. And you will need a rather large tank of lime water to absorb a ton of CO2 in a reasonable timeframe. But the chemistry is simple.
All the components of your plant should be manufactured using renewable energy, but hey lets be generous – since it is a pilot plant, I’ll give you a pass if you use solar panels and structural steel and plastic and copper and whatever else you need, all manufactured in the coal furnaces of China.
I doubt I will be one of your customers – but I assure you I will report on your progress, in winning customers for your $1000 / ton carbon disposal system. You never know, you might even make some money – there are plenty of rich celebrities dumb enough to pay $1000 to dispose of a ton of CO2. You could send customers a nice framed certificate thanking them for helping to save the Earth.
via Watts Up With That?
May 10, 2021