
Daily Archives: 31. January 2021
NASA: Antarctic sea ice is growing, but we don’t know why
Sea ice in the Southern Ocean defies predictions. Observations show that ice extent in the Antarctic it has been growing slightly.


[…] Paul Holland, a climate modeler with the British Antarctic Survey, has spent the last ten years studying Antarctica’s sea ice and the Southern Ocean. Lately, he has been scrutinizing the seasons of Antarctica and how fast the ice comes and goes. Holland thinks these seasons may be a key to a conundrum: If Earth’s temperatures are getting warmer and sea ice in the Arctic has been shrinking fast, why then is sea ice in the Antarctic slowly increasing?


Opposite poles
Sea ice is simply frozen seawater. Although found only in the Arctic and the Antarctic, it influences Earth’s climate in big ways. Its bright surface reflects sunlight back into space. Icy areas absorb less solar energy and remain relatively cool. When temperatures warm over time and more sea ice melts, fewer bright surfaces reflect sunlight back into space. The ice and exposed seawater absorb more solar energy and this causes more melting and more warming.


Scientists have been watching this feedback loop of warming and melting in the Arctic. To them, Arctic sea ice is a reliable indicator of a changing global climate. They pay the most attention in September when Arctic sea ice shrinks to its smallest extent each year. Measured by satellites since 1979, this minimum extent has been decreasing by as much as 13.7 percent per decade. Antarctic sea ice, on the other hand, has not been considered a climate change indicator. Whereas Arctic sea ice mostly sits in the middle of land-locked ocean—which is more sensitive to sunlight and warming air—Antarctic sea ice surrounds land and is constantly exposed to high winds and waves.
According to climate models, rising global temperatures should cause sea ice in both regions to shrink. But observations show that ice extent in the Arctic has shrunk faster than models predicted, and in the Antarctic it has been growing slightly. Researchers are looking much closer at Antarctica, saying, “Wait, what is going on down there?” Holland is one of those intrigued.
“The Antarctic case is as interesting as the Arctic case,” Holland said. “You can’t understand one without understanding the other.”
Minding the models
To Holland, the discrepancy calls parts of the climate models into question. Modeling groups from around the world collaborate on the Coupled Model Intercomparison Project Phase 5 (CMIP5), which simulates Earth’s climate and predicts how it will change in the near future. World leaders and policy makers rely on it to decide how much countries should limit carbon emissions, known to cause some aspects of climate change.
“Almost all of the CMIP5 models produce a decrease in Antarctic sea ice,” Holland said. “There is a problem in the bit that reproduces the last 30 years of sea ice variability.” Holland was searching for data to improve and verify his own modeling of trends in Antarctic ice when he noticed that other researchers were finding that the trends varied in strength in the different seasons.
Most studies on Antarctic sea ice trends focus on changes in ice extent. For Holland, it was more important to look at how fast the ice was growing or shrinking from season to season. “Changes in climate forcing directly affect the rate of ice growth,” he said, “not the amount of ice.” Year to year cooling in autumn, for example, may cause faster ice growth during autumn, but not necessarily an increase in the amount of autumn ice.


Spring surprise
Holland used data from NASA’s National Snow and Ice Data Center Distributed Active Archive Center (NSIDC DAAC) to calculate the ice concentration rate of growth for each single day, which he called intensification; and the total ice area rate of growth, which he called expansion. “I did that for all thirty years of data and plotted the trends,” he said. Holland’s plots showed that the different regions in the Southern Ocean contributed to the overall increase, but they had very diverse trends in sea ice growth. This suggested that geography and different wind patterns played a role. So to gain more insight Holland looked at seasonal wind trends for the different regions.
Holland found that winds were spreading sea ice out in some regions and compressing or keeping it intact in others and that these effects began in the spring. It contradicted a previous study in which, using ice drift data, Holland and Ron Kwok from the NASA’s Jet Propulsion Laboratory (JPL) found that increasing northward winds during the autumn caused the variations.
“I always thought, and as far as I can tell everyone else thought, that the biggest changes must be in autumn,” Holland said. “But the big result for me now is we need to look at spring. The trend is bigger in the autumn, but it seems to be created in spring.”
“Paul has created two more sea ice metrics that we can use to assess how Antarctic sea ice is responding,” said researcher Sharon Stammerjohn, referring to the measures of intensification and expansion. The new metrics help assess how the system is responding as opposed to simply monitoring the state of the system. “Say your temperature is at 99.2 degrees Fahrenheit,” Stammerjohn said. “You don’t have any insight to that temperature unless you take it again an hour later and you see that it changed to 101 degrees. Then you can say, okay, my system is responding to something.”


Partial explanations
Holland continues to study the Antarctic spring to better understand why Antarctic sea ice is changing. While Holland’s work helps researchers begin to see the problem in more detail, scientists continue to develop ideas about why the ice is expanding.
One study paradoxically suggests that ocean warming and enhanced melting of the Antarctic ice sheet is causing the small but statistically significant sea ice expansion in the region. Another study suggests that rain caused by a warmer climate has been causing an influx of fresh water into the Southern Ocean, making it less dense and inhibiting oceanic heat from reaching sea ice in the Antarctic. To date, there is no consensus on the reason for the expansion.
“Partial explanations have been offered, but we don’t have the complete picture,” said Ted Scambos, a scientist at NSIDC DAAC. “This may just be a case of ‘we don’t know yet.’”


Full post
The post NASA: Antarctic sea ice is growing, but we don’t know why appeared first on The Global
via The Global Warming Policy Forum (GWPF)
January 31, 2021 at 10:50AM
When Will IPCC End Its Scientific Denial: How Long Can UN Body Ignore Thousands Of Publications Disputing CO2
Despite the thousands of scientific publications refuting alarmist climate change scenarios, governments, activists and the IPCC continue to insist that we’re headed for climate catastrophe when we clearly are not.
Thanks to Kenneth Richard’s Herculean efforts and the Google Medieval Warm Period Map, we have these publications readily available.
There are reasons why in 2019 renowned astrophysicist Nir Shaviv told a Swiss news magazine that the warnings of the UN Intergovernmental Panel on Climate Change (IPCC) could not be taken seriously. The government-funded body relies on faulty models and alarmist publications, and continues to ignore a huge portion of the published rational science.
There is also the ongoing campaign aimed at preventing scientists from publishing non-alarmist findings.
One man’s Herculean effort: List of skeptic papers
One major part of the science the IPCC ignores are the long lists of “skeptic” papers we’ve been publishing here at NoTricksZone over the past years (see right side bar under “Pages”).


These listed papers go back to 2014 and undermine the claims our climate is headed for catastrophe. Included are over 3000 publications. Unfortunately, the IPCC refuses to acknowledge their significance and obstinately clings to its alarmist scenarios.
We have Kenneth Richard to thank for these lists. The task of of putting them together has been tedious and is nothing less than a Herculean effort. Kenneth deserves a lot of credit for the compilation, more than he’s gotten thus far. I know that many scientists are using these lists and that they serve as a major resource for getting the real, rational science out.
What normally would be done by an entire team of well-funded scientists, was done singlehandedly by Kenneth.
It’s our work now to make sure that these lists come to the attention of leading policymakers who still have an open ear – there are many and they are our last line of defense against climate regulatory tyranny. The COVID lockdowns we’ve seen so far are going to be nothing compared to what the climate zealots have in store for us.
Medieval Warm Period
Another factor the IPCC dismisses are papers on the colossal forces of solar variability and oceanic cycles that indeed do dominate the earth’s climate dynamics. The IPCC continues to shut out this undeniable science. Out there are thousands of scientific peer-reviewed papers showing these forces of natural cycles to be real.
IPCC even ignores itself
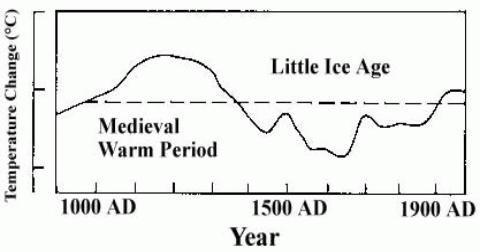
In its first report issued in 1990, the IPCC presented Figure 7c which depicted the existence of the Medieval Warm Period (MWP) and the Little Ice Age:
Steve McIntyre presented a good article about the origins of that chart.
As we know, that curve was deemed terribly inconvenient by activist scientists, who vowed to get rid of it. By 2001, the 1990 Fig. 7 was replaced by Michael Mann’s hockey stick chart in the now infamous IPCC third assessment report. In the new “hockey stick” chart, Mann et al simply airbrushed away the Medieval Warm Period, insisting that it had never been global and had been only a regional North Atlantic occurrence.
Though the IPCC continues to deny the MWP and tries to erase it from history, it’s going to be an impossible task to eliminate it from the scientific literature and record. It’s not going away. The sheer volume of science behind it is simply overwhelming.
Google Map of MWP papers
An outstanding body of science supporting the MWP is the comprehensive collection of scientific literature put together by German skeptic site Die kalte Sonne; the Google Maps chart,
It comprises more than 1200 papers providing solid evidence of the existence of the Medieval Warm Period and that the planet’s climate behaves cyclically and was never limited to a narrow and stagnate range of variability like the dubious Mann Hockey stick chart suggests.


Image cropped from Google Maps here.
The producer of this valuable tool says he still has many more papers to enter on the map, but time is in short supply in his already very busy schedule.
Viewed more than 250,000 times
So far the Google Medieval Warm Period Map has been viewed more than 250,000 times.
It’s really important this year for readers to spread these two important resources: a) The Skeptic papers and 2) the Google Medieval Warm Period Map.
via NoTricksZone
January 31, 2021 at 10:18AM
Apple bans on Gab, Parler, and Breitbart make iPhone a defective product

It is bizarre enough when Google, Facebook, and Twitter ban conservative expression.
But it is incredible when Apple does the same thing with its products (smartphones and tablets). A service provider, like Google, Facebook, or Microsoft, has some latitude in how it provides its services.
A product manufacturer however, has no such latitude. It is liable for all defects that impair the product’s function, which used to be unintentional. Third party apps are the main feature of a smartphone. However, Apple uses its App Store to impair iPhone when the consumers want to view conservative information, use social networks that do not discriminate against conservatives (like Parler), and access healthcare information which Apple does not like or which tends to cut into its profits. Even more egregiously, Apple lies to its consumers about these actions.
In other words, iPhone buyers have the right to use Parler, Gab, and whatever other apps are banned by Apple, and have legal standing to protect this right. Apple cannot simply take away this right, through a user agreement that all users are forced to “accept.”
In November 2016, Apple removed the Breitbart app for a few days. In the same time Apple allowed an anti-Breitbart app – News Pro-Breitbart Edition – even though it was clearly infringing on Breitbart’s trademark. Many people alarmed by the ban found News Pro-Breitbart Edition, and concluded that the ban on Breitbart was a conspiracy theory.
Breitbart was one of the top media websites, ranking in line with Bloomberg and CBS News, and above ABC News and the Guardian.
via Science Defies Politics
January 31, 2021 at 09:20AM
Davos: Green transition is ‘$50-trillion investment opportunity’


So is it about a claimed ‘climate emergency’ or, more likely, ‘an acceptable return for investors’?
– – –
Financing the global shift away from fossil fuels could earn investors trillions, according to discussions at the World Economic Forum.
But there’s not enough data to get the money where it’s needed, says DW.com.
The investment opportunity presented by the transition to a green global economy has been a key topic on the agenda at the 2021 World Economic Forum.
The week-long summit — held online this year due to the global coronavirus outbreak — devoted over a day’s worth of discussions to issues surrounding climate change, including how to restructure an economy based around the consumption of carbon-producing fossil fuels.
Over several panels, both politicians and business leaders highlighted the economic potential of the green transition. The real challenge, they said, will be getting investments where they are needed most.
From shareholder to stakeholder
The transition toward an environmentally stable global economy represents a $50 trillion (€41 trillion) investment opportunity, said Bill Winters, Group CEO of the UK-based Standard Chartered Bank, speaking on a panel about how to finance the transition to a global society free of carbon emissions.
“These are interesting assets,” he said, “both for social reasons, and because they should generate an acceptable return” for investors.
Continued here.
via Tallbloke’s Talkshop
January 31, 2021 at 08:25AM
China nixes Antony Blinken climate appeal over Uighur genocide claims


WASHINGTON — China’s Communist government smacked-down Secretary of State Antony Blinken’s appeals to work together on climate change after he said he agreed that the Chinese government’s treatment of Uighur Muslims amounted to “genocide.”
In a new statement released on Twitter, China’s foreign ministry accused Blinken of “interfering in its domestic affairs and undermining its interests” after he backed predecessor Mike Pompeo’s declaration that it had launched “a systematic attempt to destroy Uyghurs.”
“China is willing to work with the US on climate change. But such cooperation cannot stand unaffected by the overall China-US relations,” the statement read.
“It is impossible to ask for China’s support in global affairs while interfering in its domestic affairs and undermining its interests,” it added.
At his first press conference as Biden’s secretary of state on Wednesday, Blinken was asked by a Chinese journalist how the US would work with China with the genocide designation hanging over the relationship.
Blinken danced around the issue and said the US was able to compartmentalize difference issues with the Communist nation, which he described as “the most important relationship we have,” and called on them to step up alongside America to confront climate change.
“It’s not a secret that the relationship between the United States and China is arguably the most important relationship that we have in the world going forward,” Blinken said, adding it had increasingly “adversarial aspects.”
He said that the countries could still work together on “mutual interests” like the environment, despite their enormous ideological differences.
via Watts Up With That?
January 31, 2021 at 08:24AM
January 31, 2021, ~ Meteor ~ Popocatepetl Volcano, Mexico ~ 01:10 CST

Space Weather Update January 31st 2021! 7 Hours Missing Data

Merapi Activity Live Streaming

Metro Chicago IL Winter Storm Warning – 1/21/2021
