Dr. David Legates has been Fired by White House OSTP Director and Trump Science Advisor, Kelvin Droegemeier
President Donald Trump has been sympathetic with the climate skeptics’ position, which is that there is no climate crisis, and that all currently proposed solutions to the “crisis” are economically harmful to the U.S. specifically, and to humanity in general.
Today I have learned that Dr. David Legates, who had been brought to the Office of Science and Technology Policy to represent the skeptical position in the Trump Administration, has been fired by OSTP Director and Trump Science Advisor, Dr. Kelvin Droegemeier.
The event that likely precipitated this is the invitation by Dr. Legates for about a dozen of us to write brochures that we all had hoped would become part of the official records of the Trump White House. We produced those brochures (no funding was involved), and they were formatted and published by OSTP, but not placed on the WH website. My understanding is that David Legates followed protocols during this process.
So What Happened?
What follows is my opinion. I believe that Droegemeier (like many in the administration with hopes of maintaining a bureaucratic career in the new Biden Administration) has turned against the President for political purposes and professional gain. If Kelvin Droegemeier wishes to dispute this, let him… and let’s see who the new Science Advisor/OSTP Director is in the new (Biden) Administration.
I would also like to know if President Trump approved of his decision to fire Legates.
In the meantime, we have been told to remove links to the brochures, which is the prerogative of the OSTP Director since they have the White House seal on them.
But their content will live on elsewhere, as will Dr. Droegemeier’s decision.
[NOTE: Dr. Spencer has hosted each of these documents on his own site, and we have uploaded them to our website in case the purges continue and widen.]
See a lot of the presentations by David Legates at The Heartland Institute’s 13 International Conferences on Climate Change at this archived link. He also took part in a debate challenge in NYC hosted by John Stossel in 2019. You can watch that here (the “other side” didn’t show up.) And if you want to see David Legates LIVE, he’s likely to be a presenter at Heartland’s 14th International Conference on Climate Change in Las Vegas April 16-17, 2021 in Las Vegas. Register for that conference here.
Late last year, several of us were asked by David Legates (White House Office of Science and Technology Policy) to write short, easily understandable brochures that supported the general view that there is no climate crisis or climate emergency, and pointing out the widespread misinformation being promoted by alarmists through the media.
Below are the resulting 9 brochures, and an introduction by David. Mine is entitled, “The Faith-Based Nature of Human Caused Global Warming”.
David hopes to be able to get these posted on the White House website by January 20 (I presume so they will become a part of the outgoing Administration’s record) but there is no guarantee given recent events.
He said we are free to disseminate them widely. I list them in no particular order. We all thank David for taking on a difficult job in more hostile territory that you might imagine.
UPDATE (Jan 13, 3:50 p.m. CT): The links to these documents have been removed at the request of Dr. Legates. We hope to put them back up soon.
Introduction (Dr. David Legates)
The Sun Climate Connection (Drs. Michael Connolly, Ronan Connolly, Willie Soon)
Systematic Problems in the Four National Assessments of Climate Change Impacts on the US (Dr. Patrick Michaels)
Record Temperatures in the United States (Dr. John Christy)
Radiation Transfer (Dr. William Happer)
Is There a Climate Emergency (Dr. Ross McKitrick)
Hurricanes and Climate Change (Dr. Ryan Maue)
Climate, Climate Change, and the General Circulation (Dr. Anthony Lupo)
Can Computer Models Predict Climate (Dr. Christopher Essex)
The Faith-Based Nature of Human-Caused Global Warming (Dr. Roy Spencer)
Blizzard warning for Central U.S. (South Dakota, Missouri, Iowa, Minnesota, Nebraska). Additionally, 15 states are on alert for damaging winds and heavy snow.
In blizzard areas, travel could be very difficult if not impossible at times.
The heaviest of the snow will begin late tonight into Friday morning from Minnesota into Iowa, Wisconsin and parts of northern Illinois and Missouri.
Snowfall totals will range from 6 inches to as much as a foot of snow possible for Minnesota and parts of northern Iowa.
Part of that same storm will move into the Northeast by Friday night, where more than 6 inches of heavy snow is exected in upstate New York and northern New England.
Relatively colder air behind the storm will produce additional snow in parts of western New York and Pennsylvania this weekend.
For an example, here’s what the National Weather Service has to say about North Central Iowa:
Extremely stout winds coupled with moderate to heavy snow will lead to blizzard conditions tonight and throughout much of the day Friday over the central to western sections of Iowa. The heaviest snowfall is likely to fall over north central portions of the state, but even further south and west blizzard conditions are anticipated. Significant travel impacts are expected, especially along Interstates 80 and 35.
…WINTER WEATHER ADVISORY UNTIL 6 PM CST THIS EVENING… …BLIZZARD WARNING FROM 6 PM THIS EVENING TO 6 PM CST FRIDAY…
* WHAT…For the Blizzard Warning, blizzard conditions expected. Total snow accumulations of 5 to 8 inches. Winds gusting as high as 45 mph.
* IMPACTS…For today, some travel impacts are possible. For tonight through Friday, travel could be very difficult if not impossible at times with blowing snow significantly reducing visibility. The hazardous conditions will impact the Thursday evening, Friday morning, and Friday evening commutes.
PRECAUTIONARY/PREPAREDNESS ACTIONS…
Travel should be restricted to emergencies only. If you must travel, have a winter survival kit with you. If you get stranded, stay with your vehicle.
Slow down and use caution while traveling.
The latest road conditions for the state you are calling from can be obtained by calling 5 1 1.
“More than 45 years after gray wolves were first listed under the Endangered Species Act (ESA), the Trump Administration and its many conservation partners are announcing the successful recovery of the gray wolf and its delisting from the ESA. U.S. Secretary of the Interior David L. Bernhardt was at the Minnesota Valley National Wildlife Refuge to announce that state and tribal wildlife management agency professionals will resume responsibility for sustainable management and protection of delisted gray wolves in states with gray wolf populations, while the U.S. Fish and Wildlife Service (Service) monitors the species for five years to ensure the continued success of the species.” — U.S. Fish and Wildlife Service, October 29th, 2020
In Episode 135 of District of Conservation, Gabriella discusses some new bills just introduced in Congress relating to wildlife conservation, public lands, and gun rights.
The world is entering a new “space age” as launches from Space X and others are achieving amazing feats of technology.
While this brings amazing prospects of space exploration and even an eventual visit to Mars for humanity, it’s not all good news.
The uptick in space activity has brought the issue of “space junk” to the forefront.
While there may not be much of an “environment” to pollute in space, it can become an issue of safety to future launches as satellite and rocket debris continually orbit Earth without easily burning up. This junk could eventually start falling on Earth, which raises safety and pollution concerns.
That’s why Sumitomo Forestry in Japan is planning to experiment with wooden satellites in what they call “extreme environments.” If aspects of our space exploration can be made of wood rather than metal, they say, the materials can simply burn up in the atmosphere once they have exhausted their usefulness.
The type of wood they have in mind, as well as how they plan on even getting such a satellite into orbit in the first place, has not yet been revealed.
According to the BBC:
“Sumitomo Forestry, part of the Sumitomo Group, which was founded more than 400 years ago, said it would work on developing wooden materials highly resistant to temperature changes and sunlight.
“The wood it is using is an ‘R&D secret’ a spokesman for the company told the BBC.”
BBC continued to report that:
“There are nearly 6,000 satellites circling Earth, according to the World Economic Forum (WEF). About 60% of them are defunct (space junk).
“Research firm Euroconsult estimates that 990 satellites will be launched every year this decade, which means that by 2028, there could be 15,000 satellites in orbit.”
San Antonio Election Fraudster – Source: TX Attorney General Ken Paxton
In a press release dated 13 Jan 2021, Texas Attorney General Ken Paxton announced the arrest of Rachel Rodriguez for election fraud, illegal voting, unlawfully assisting people voting by mail, and unlawfully possessing an official ballot. Each charge constitutes a felony under the Texas Election Code. Rodriguez was exposed in a Project Veritas video last fall while she engaged in vote harvesting leading up to the 2020 election. The Election Fraud Division of the Office of the Attorney General reviewed dozens of hours of unedited, raw footage, which led to this arrest. In an uncharacteristic moment of honesty, Rodriguez acknowledged on video that what she was doing is illegal and that she could go to jail for it. If convicted, Rodriguez could face up to 20 years in prison.
“Many continue to claim that there’s no such thing as election fraud. We’ve always known that such a claim is false and misleading, and today we have additional hard evidence. This is a victory for election integrity and a strong signal that anyone who attempts to defraud the people of Texas, deprive them of their vote, or undermine the integrity of elections will be brought to justice,” said Attorney General Paxton. “The shocking and blatantly illegal action documented by Project Veritas demonstrates a form of election fraud my office continually investigates and prosecutes. I am fiercely committed to ensuring the voting process is secure and fair throughout the state, and my office is prepared to assist any Texas county in combating this insidious, un-American form of fraud.”
This investigation is ongoing. Individuals involved in or with knowledge of this organized vote harvesting scheme are encouraged to come forward and cooperate with the Office of the Attorney General.
At long last, following the warming effect of the El Niño of 2016, there are signs of a reasonably significant La Niña, which may well usher in another Pause in global temperature, which may even prove similar to the Great Pause that endured for 224 months from January 1997 to August 2015, during which a third of our entire industrial-era influence on global temperature drove a zero trend in global warming:
As we come close to entering the la Niña, the trend in global mean surface temperature has already been zero for 5 years 4 months:
However, the new Pause is at a surface-temperature plateau 0.3 C° above the old Pause:
That is equivalent to a not particularly terrifying centennial warming rate of 1.25 C° over the 19 years covering the two pauses and the warming in between.
Since the projected net anthropogenic radiative forcing over the 21st century is approximately equivalent to the 3.5 W m–2 forcing from doubled CO2, the indications are that equilibrium sensitivity to a CO2 doubling, known as equilibrium CO2 sensitivity (ECS) or Charney sensitivity, is a great deal smaller than the 3 C° originally estimated by Charney in 1979 and the 4 C° projected by models. Let us test that proposition not with models but with data.
It is possible to derive ECS directly from observational data, with the help of the following handy equation. The anthropogenic equilibrium sensitivity ΔEt over a given period from time t to time t+1is the product of the anthropogenic fraction M of observed period global mean surface warming ΔTt and the ratio of the period anthropogenic forcing ΔQt to the difference between ΔQt and the period anthropogenic fraction M of the Earth’s observed energy imbalance ΔNt.
From 1850-1980, net anthropogenic forcing ΔQ1 was 1.25 W m–2 (IPCC 2013, fig. SPM.5). The Planck sensitivity parameter for 1850 was about 0.3 C° W–1 m2. Their product was the 0.37 C° period anthropogenic reference sensitivity ΔR1 (i.e., the direct warming before adding feedback response). By coincidence, ΔR1 was equal to the observed period warming trend ΔT1 (HadCRUT4). Wu et al. (2019) give the anthropogenic fraction M of observed global warming as 0.7. Using the equation, period equilibrium sensitivity ΔE1 was 0.39 C°. The system-gain factor A1 = ΔE1 / ΔR1, which allows for feedback response, was just 1.005.
From 1980-2020, net anthropogenic forcing ΔQ2 was 1.65 W m–2 (NOAA AGGI index, 2020, adjusted for ozone, aerosols and black carbon). The product of that value and the Planck sensitivity parameter was the 0.49 C° period anthropogenic reference sensitivity ΔR2. The observed period warming trend ΔT2 (HadCRUT5) was 0.7 C°. For M = 0.7, the equation gives period equilibrium sensitivity ΔE2 as 0.54 C°. The system-gain factor A2 = ΔE2 / ΔR2 was 1.1.
Given the 3.5 W m–2 radiative forcing ΔQ3 equivalent to a doubling of CO2 concentration (Zelinka et al. 2020) compared with that year, the reference sensitivity ΔR3 to doubled CO2 is 1.05 C°. Finally, to allow for nonlinear growth in feedback response with temperature, we need to know the approximate rate at which the system-gain factor increases over time. That is why we studied the two recent periods which, taken together, constitute the climatological industrial era. From 1850-1980 the system-gain factor was 1.05; from 1980-2020 it was 1.1. Therefore, a respectable approximation for the period following 2020 is 1.15.
Accordingly, midrange ECS – currently imagined to be 3.7 C° (Meehl et al. 2020) or even 3.9 C° (Zelinka et al. 2020), is actually 1.05 x 1.15, or 1.2 C°, very much in coherence with the 1.25 C° centennial-equivalent warming rate of the past 19 years.
Why, then, is the world panicking about global warming? The reason is that climatologists imagined that the 32 C° natural greenhouse effect, the difference between the 255 K emission temperature that would obtain in the absence of greenhouse gases and the 287 K surface temperature in 1850, comprised 24 C° preindustrial feedback response entirely attributable to the 8 C° reference sensitivity forced by the preindustrial noncondensing greenhouse gases.
They had not appreciated that most of the 24 C° preindustrial feedback response was not driven by the 8 C° preindustrial noncondensing greenhouse gases but by a quantity 30 times larger: namely, emission temperature itself. The feedback response to those gases was thus minuscule: probably less than 1 C° of the 24 C°. Sure enough, the feedback responses from 1850-1980, from 1980-2020 and from 2020 to doubled CO2 work out at just 0.02 C°, 0.05 C° and 0.16 C° respectively. End of climate “emergency”.
It will be interesting to see how long the current Pause will endure. At the moment, we are not quite in formal La Niña conditions. In the table below, warm periods (shown in red) and cold periods (blue) are based on a threshold of ±0.5 C° in the Oceanic Niño Index, which is the three-month running mean of the ERSST v. 5 sea-surface temperatures in the Niño 3.4 region of the equatorial eastern Pacific from 5° North to 5° South of the Equator and from 120° to 170° West of the universal meridian.
Technically, a full-on El Niño (warming period: red) or La Niña (cooling period: blue) is only declared after five consecutive three-month periods above or below the ±0.5 C° threshold. So far, there have been four months below the lower threshold. If, as seems likely, the period from November to January also crosses the lower threshold, we shall be in a proper La Niña, which may endure for another few months, lengthening the Pause perhaps until the Glasgow climate conference this December. Watch this space.
Scientists continued defying the “unprecedented” global warming narrative by publishing nearly 150 papers in 2020 that show large regions of the Earth (a) haven’t warmed in recent decades, (b) were as-warm or warmer within the last several centuries, and/or (c) were 1-7°C warmer than today just a few millennia ago.
Here is the link to the 2020 (and 2019) Non-Global Warming scientific paper database:
Below are 8 examples of the 148 non-global warming papers published in 2020.
Martin et al., 2020 France max Holocene temps (14°C) were 7°C warmer than the modern value (7°C)
“Modern climatic parameters were obtained from the instrumental database of Meteo-France at the nearby station of Mazet-Volamont (1130 m) located 11 km distant, for the period 2009-2017 … Temperature values were corrected using a lapse rate of 0.6°C/ 100 m. Mean annual temperatures vary between 6 and 9°C with a mean value of 7°C. … The mean annual temperature for the entire Holocene was 11.3°C, i.e. 4.1°C above the modern value. The maximum of 14°C and a minimum of 7.6°C were reached, respectively, at 7.8 and 1.7 kyr cal BP. … The last 200 years display an opposite trend … MAAT decreased by 3.1 and 3.3°C for the lake calibrations, Sun et al. (2011) and Russell et al. (2018), respectively, and 2.1°C for the soil calibration.”
Hou et al., 2020W. Tropical Atlantic 1-5°C warmer throughout last ice age (190 ppm CO2)
“Our results indicate a lack of pronounced glacial-interglacial variability in the SST record, prompting us to exclude atmospheric pCO2 as a direct driver of SSTvariations in the southern WTA [western tropical Atlantic].”
Xia et al., 2020Subantarctic Georgia “summer temperature between 10°C and 5°C higher than present”
“Although the biomarker-based paleotemperature proxy has been calibrated for modern temperature data of regional lakes, summer temperatures as high as 14°C reconstructed from Fan Lake are outside the range of their modern calibration dataset in which the warmest site has a summer temperature of only 10°C (Foster et al., 2016) … The CARs increased to as high as 140 g C m² yr¹ at 4000-3500 cal yr BP and 70 g C m² yr¹ at 3200-2700 cal yr BP when summer temperature was around 10°C and 5°C higher than present, respectively “
Gebbie, 2020Modern global ocean heat 1/3rd of what’s required to reach Medieval levels
“The cold decades after 1950 coincide with the Great Salinity Anomaly in the late 60s to early 70s, caused by the long-term decrease of the North Atlantic Oscillation (NAO) index favoring the export of freshwater and ice through Fram Strait into the EGC (Dickson et al., 1996). Within two or three years, the associated salinity anomaly reached the Labrador Sea causing a reduction of the convection and subsequent weakening of the Atlantic Meridional Overturning Circulation (AMOC). This mechanism explains the low temperature on the SE-Greenland shelf and the positive AMV during this time period (Ionita et al., 2016, Figure 6d). … Displayed in the alkSST record from Skjoldungen as well as in the CTD measurements off Skjoldungen (Figure 5d) is a return to lower temperatures post 2006, pointing out the exceptional high temperatures around 2000. … Our study shows that even though the meltwater production may have been influenced by climate, the glacier margin position and iceberg calving remained relatively constant in the 20th century. This may be due to the setting of the glacier with a limited ice-ocean interface and a 90° inflow angle acting as a pinning point in its current position. Our study illustrates that ocean heat may have a limited effect on some marine glaciers.”
Sun et al., 2020NW China no warming since 1600s, cooling since 1950
Singh et al., 2020“The Antarctic continent has not warmed in the last seven decades”
“Low Antarctic continental climate sensitivity due to high ice sheet orography … The Antarctic continent has not warmed in the last seven decades, despite a monotonic increase in the atmospheric concentration of greenhouse gases.”
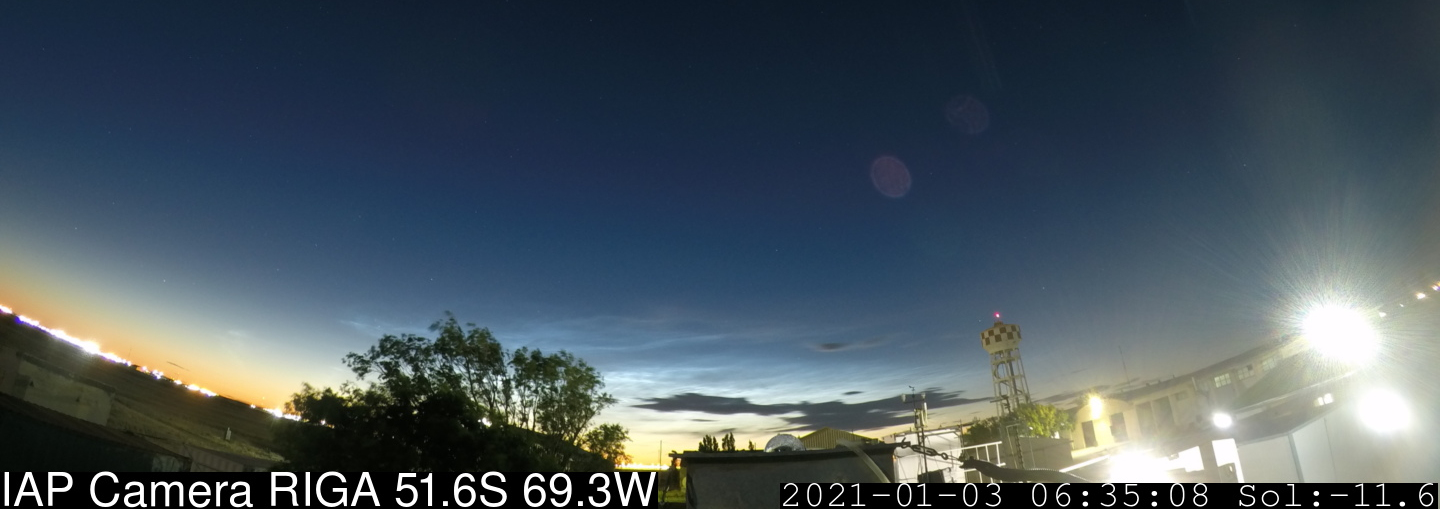
They’re back. Noctilucent clouds (NLCs), recently missing, are once again circling the South Pole. And, in an unexpected twist, they’ve just appeared over Argentina as well.
“This is a very rare event,” reports Gerd Baumgarten of Germany’s Leibniz-Institute of Atmospheric Physics, whose automated cameras caught the meteoritic clouds rippling over Rio Grande, Argentina (53.8S) on Jan. 3rd:
A second camera recorded the clouds at even higher latitude: Rio Gallegos (51.6S). At this time of year, noctilucent clouds are supposed to be confined to the Antarctic–not Argentina. In the whole history of atmospheric research, NLCs have been sighted at mid-southern latitudes only a handful of times.
“Personally, I am thrilled to see NLCs in Argentina, as I had not expected them to occur so far north,” says Natalie Kaifler of the German Aerospace Center (DLR), who operates a lidar (laser radar) alongside one of Baumgarten’s cameras.
Kaifler’s lidar “pinged” the clouds during the display and confirmed that they are genuine NLCs. Echoes pinpointed their altitude more than 80 km above Earth’s surface:
Above: The ~hour-long oscillations in these lidar echoes may be caused by gravity waves propagating upward from the Andes 82 km below.
NLCs are Earth’s highest clouds. They form when summertime wisps of water vapor rise up from the poles to the edge of space. Water crystallizing around specks of meteor dust ~83 km above Earth’s surface create beautiful electric-blue structures, typically visible from November to February in the south, and May to August in the north.
This season has been unusual, though. The normal onset of NLCs over the South Pole has been delayed for more than a month as strange weather patterns played out above Antarctica. Now, suddenly, they’re back, and showing up in unexpected places.
Baumgarten has set up two cameras in southern Argentina to catch unexpected NLCs. “If it happens again,” he says, “we’ll let you know.” Stay tuned!
Back in 2016, Bristol City Council set up Bristol Energy, the first municipal energy company in the South West and one of the first in the country, amidst grand hopes:
Bristol Energy,the first municipal energy company in the South West and one of the first in the country, is officially open for business.The energy supply company was created by Bristol City Council in 2015 to be a force for social good. It is leading the way as a new model of energy company that contributes to the wellbeing of local communities.
With a fundamental belief in social responsibility, Bristol Energy will reinvest profits back into its founding city, supporting council services to citizens and community projects. The company is looking to support local renewable energy generators and to link with initiatives with a shared ethos across the city and region.
Managing Director, Peter Haigh, said: “This is a new era for the sector, and Bristol Energy is proud to set itself apart from other energy companies as a force for social good. We believe that energy customers, businesses and communities deserve something better, now and into the future – and this means doing things differently. I really believe people will want to get behind us. We have to pay energy bills anyway, so why not pay them to a company that will spend the profits on local services and projects?
“Our growing Bristol Energy team has worked incredibly hard to get us to the point where people can make a no-fuss switch to us through our website. One of our next steps will be to find ways to help the least advantaged energy consumers through our products and services and to build partnerships with local renewable generators. In the longer term, I can’t wait to see the difference our profits will make to local Bristol communities.”
What could possibly go wrong? Green energy, a social conscience, reinvesting profits back into the community?
Four years later, however, the Council is nursing losses of £40m, and have been forced to sell the customer base on the cheap.
A troubled council-owned energy company revealed a £14.8m loss in its latest annual report.
Bristol Energy, sold off by Bristol City Council last year, made the losses in the year up to March 2020.
The council’s Conservative group leader, Mark Weston, said the figures, which take the overall losses to around £40m, were “truly shocking”.
It was revealed last year that the company’s boss was given a nearly £95,000 payout when he left.
The annual report showed Bristol Energy, which was set up in 2015 before the current Labour administration took over, posted an adjusted operating loss of £8.5m in the year up to 31 March 2020.
Released on 10 January, the report said that figure does not take into account just under £3.3m in “bad debt” and other costs, such as £219,000 for restructuring.
When these extra costs are included, the official operating loss is £13.26m, and when interest and tax are taken into account, the total loss was £14.8m.
Bristol Energy, which was set up to provide ethically-sourced and low-cost energy, sold its domestic and business accounts in the autumn of 2020.
The city council has so far invested £37.5m in the business, which has posted losses above £10m every year since 2018, despite growing its customer base.
‘Millions squandered’
Mr Weston said he suspected the final losses would be “something north of £50m”.
“The squandering of tens of millions of pounds of public funds on this project, long after it should have been terminated, represents an unparalleled example in our city of poor political judgement and financial mismanagement,” he said.
Bristol City Council has asked its own auditors Grant Thornton to find out the full extent of the cost to council taxpayers of setting up and running the company.
There is no evidence that Bristol Energy actually sold at less than market rates. (Current prices of the now sold company are over 10% dearer than my deal, which is only three months old).
Meanwhile a similar story has been emerging in Nottingham, where council owned Robin Hood Energy has just gone into administration, leaving Nottingham council taxpayers on the hook for £38m:
The company set up by Nottingham City Council to challenge the ‘big six’ energy firms has been placed into administration.
The Robin Hood Energy (RHE) customer base has been sold to Centrica – owned by British Gas, one of the ‘big six’, and administrators Deloitte is now in charge of the firm.
An outstanding £12.5 million owed for green taxes known as Renewable Obligations Certificates (ROCs), to energy regulator OFGEM, is expected to be spread across the rest of the energy market.
This effectively means all other consumers – from companies with no link to RHE – will foot the bill.
It had been suggested that the £12.5 million would be taken by administrators from the amount Nottingham City Council receives from the sale, meaning Nottingham taxpayers would pay the bill.
But the city council says it expects the bill to be ‘mutualised’ from the rest of the energy market.
Speaking on Monday, January 11, during a meeting of the full council, Councillor Sam Webster was asked by Councillor Kevin Clarke, leader of the Clifton Independents, about the £12.5 million payment.
As with Bristol Energy, Robin Hood boasted about 100% green electricity and a social conscience. Particularly ironic, given that Nottingham Council have even refused to pay the £12.5m owing for green subsidies, the ROCs which all energy suppliers have to pay.
In this important contribution to our series on post-Brexit Britain Professor Gordon Hughes and Dr John Constable take on the entire green energy movement in arguing that the widespread view about the falling costs of renewable energy is wrong. They view official government projections of energy costs and hence prices as disgracefully inaccurate. Energy costs will be an important element in the UK’s future economic competitiveness and, if the authors are correct, energy prices are in for huge price rises.
The dramatically falling costs of renewables are now a political, a media, and conversational cliché. However, the claim is demonstrably false. Audited accounts show that far from getting cheaper, wind power is actually becoming more expensive. The failure of the British civil service to detect this fact and, hence, to protect the consumer and taxpayer from the consequences of the looming failure of the renewables sector raises important questions about the analytic competence of the Whitehall machine.
If we asked a random sample of broadsheet newspaper readers about the economics of offshore wind, it is practically certain that a majority of those interviewed would say they believed it was now cheap. A similar survey of investment analysts and advisors might return the same answer. Politicians and journalists would be certain about the matter. However, if pressed for evidence none of these groups could do much more than point to secondary sources. Some might remember that the Greenpeace sponsored an extensive advertising campaign in 2017, with full page adverts in the press. Others might point out that official bodies present offshore wind as the cheapest source of electricity. Those in financial circles might also indicate that almost every report or lengthy article on the future role of offshore wind power is accompanied by a chart which claims to show the rapid decline of costs over the last one or two decades, perhaps with forward projections to 2030 or 2040.
Incredible though it may seem, none of this is true. Neither offshore nor onshore wind has become cheaper; indeed, both have become more expensive over the last two decades.
How do we know this? Because one of us, Gordon Hughes, has compiled data from audited accounts on the capital and operating costs of 350 onshore and offshore wind farms in the United Kingdom, a set which covers the majority of the larger wind farms (> 10 MW capacity) built and commissioned between 2002 and 2019. It is the largest study of its kind to date and will be published shortly by the charity Renewable Energy Foundation, which John Constable directs.
In summary, analysis of the data reveals unequivocal findings:
The actual costs of onshore and offshore wind generation have not fallen significantly over the last two decades and there is little prospect that they will fall in the next five or even ten years.
While some of the components which feed into the calculation of costs have fallen, the overall costs have not. For example, the weighted return for investors and lenders has declined sharply, especially for offshore wind, because of a fall in perceived risk. In addition, the average output per MW of new capacity may have increased, particularly for offshore turbines. However, these gains have been offset by higher operating and maintenance costs (O&M).
Far from falling, the actual capital costs per MW of capacity to build new wind farms increased substantially from 2002 to about 2015 and have, at best, remained constant since then. Reports of the costs of building new offshore wind farms in the early 2020s imply that their costs may fall by 2025, but such reports are consistently unreliable as well as being incomplete. Final costs tend to be significantly higher, so little weight can be attached to forecasts of future costs.
Far from falling, the operating costs per MW of new capacity have increased significantly for both onshore and offshore wind farms over the last two decades. In addition, operating costs for existing wind farms tend to grow even more rapidly as they age. The increase for new capacity seems to be due to the shift to sites that are more remote or difficult to service. Much of the increase with age is due to the frequency of equipment failures and the need for preventative maintenance, both of which are strongly associated with the adoption of new generations of larger turbines – both onshore and offshore.
Turbine manufacturers and wind operators appear to be relying on an increase in load factors (a measure of the generator’s energy productivity) via (i) an increase in hub heights to take advantage of higher wind speeds, and (ii) changes in the engineering balance between blade area and generator capacity. However, the inferior reliability of new turbine generations leads to a more rapid decline in performance with age, so that the ultimate effect on average performance over the lifetime of new turbines is not clear.
The combination of increasing operating and maintenance costs with the decline in yields due to ageing means that at current market prices the expected revenues from electricity generation will be less than expected operating costs after the expiry of contracts guaranteeing above-market prices. The length of these contracts has been reduced, implying a need to recover capital costs over a shorter economic life which pushes up the effective capital charge.
There is an important corollary to these findings. The current set of offshore projects being constructed and planned in North Western Europe are closely akin to speculative property development. They are high risk projects that will only be able to repay lenders and offer a return to equity investors if the average wholesale market prices of power rise to at least three to four times their current level throughout North West Europe. Such a price surge would require either a large and permanent increase in the market price of gas, which experience suggests is very unlikely, or carbon taxation at 8 to 10 times current levels, rising to at least €200 per tonne of carbon dioxide at 2018 prices in 2030. Such a tax would place a heavy burden on the rest of the economy.
This has consequences for financial regulation. To discharge their responsibilities financial regulators ought to impose a heavy risk weighting on loans to offshore wind farm operators, while also advising that green equity investments are too risky for pension funds and small investors. Instead, the chiefs of the European Central Bank (ECB), the Bank of England and other regulators have urged more investment in green assets without acknowledging the risks involved.
This leads to the prospect of what is not so much a car crash as a motorway pile up in the fog of ignorance. The looming crisis will require that those who finance wind power and its related ecosystem of companies are bailed out by either taxpayers or electricity consumers. The scale of the bailout would be large: about £30 billion is at risk in the UK wind sector alone, with significantly more in Germany, the Netherlands and Denmark.
Some wind industry players may be aware that specific projects are not performing in line with general expectations – there is no lack of examples reported in specialist media. However, until very recently investors have been protected by generous subsidies and operators are likely to blame project-specific factors rather than realising that the entire sector is affected. In addition, the industry in general seems believe its own propaganda, for which basic error they have only themselves to blame.
Government, we suspect, is genuinely confused. On the 24th of August while we were preparing this summary for Briefings for Britain the Department of Business, Energy and Industrial Strategy (BEIS) published its latest set of electricity generation cost estimates, Electricity Generation Costs.[1] It recommits BEIS to the view that the costs of wind power have fallen and that this technology is now amongst the cheapest available.
However, it is not difficult to show that the BEIS analysis is wholly, almost pitifully, inadequate and that it cannot be relied upon. We will discuss it in some detail below because the mistaken view that it gives of wind economics is important in itself. Even more, it provides a graphic illustration of the truly wretched quality of the analytical work that underpins policy decisions with vast implications for the United Kingdom and its people.
Before making more detailed observations, we note two general aspects of the BEIS study. First, it purports to provide estimates or forecasts of electricity generation costs for projects commissioning in 2025, 2030, 2035 and 2040. While costs at the nearest of these dates can be estimated rationally, costs a decade or more in the future are radically uncertain. To attempt even moderately precise costings, as BEIS does, suggests naivety or hubris. Who in 2000 – or even in 2010 – had any realistic basis for forecasting the capex and opex costs for projects that are being commissioned in 2020?
Furthermore, on examining the accompanying spreadsheet containing the Department’s detailed assumptions it turns out that 94 per cent of the model parameters for the various technologies, conventional and renewable, do not change from one period to the next. This is implausible, since it must presume that there is no technological progress in those fields. Where costs do vary they are for either (a) wind and solar, or (b) a range of minor (Geothermal CHP) or novel (wave, biomass with CCS) technologies. This is unreasonable. If there are cost reductions in the renewable sector, why rule out cost reductions in the conventional sector?
Looked at in more detail this underlying bias is quite extraordinary. The rates of decline in capex and opex costs or increases in operating performance for offshore wind – now a mature technology – are greater and more sustained than the decline for CCGT+CCS – a new and potentially critical technology.
Consequently, the BEIS projections of short-term costs are almost trivial, merely generic costs for the middle of the current decade, while the estimates of relative costs of conventional and renewable generation in the medium and longer term are at best meaningless and at worst misleading.
A second general point that should be noted is that the data used in the BEIS model is almost entirely derived from work conducted by or for the department itself. With the exception of a single reference to a National Grid ESO report, all of the sources cited for the data are BEIS publications or BEIS-commissioned reports. No attempt has been made to draw upon the growing academic and policy literature on the actual costs of building and operating various kinds of generation. There is not even a single reference to the extensive studies undertaken by the Energy Information Agency (EIA) in the US and various of the research laboratories funded by the US Department of Energy (DoE) – for the example the Lawrence Berkeley National Laboratory (LBNL), the National Renewable Energy Laboratory (NREL) or the Oak Ridge National Laboratory (ORNL). Such a narrow focus is hard to justify, and indeed begins to look like a deliberate blindness in which all data is selected to fit with a pre-determined narrative.
And of course it is also true that BEIS has not made any effort to undertake the empirical investigation of audited accounts that forms the data behind the Hughes study summarised above.
Bearing these general remarks in mind, we will now compare some of the specific assumptions in the BEIS study with the results of the data compiled for this and other studies.
Conveniently BEIS has adopted the same base year (2018) for real prices as the one used for the Hughes database, so there is no need for adjustment. We will start by examining capex costs and then opex costs before looking at load factors and financial parameters. In all cases we will use the BEIS assumptions for projects commissioned in 2025, since, as noted above, the BEIS estimates for later dates are mere speculation. We will focus on onshore wind, offshore wind and large scale solar as those are the primary technologies for which BEIS has updated its assumptions and for which comparisons with actual data from company accounts are possible.
Capex costs. The BEIS assumptions imply total capex costs (including capitalized interest) in 2025 of £1.30 million per MW for onshore wind, £2.16 million per MW for offshore wind (or £1.82 million excluding transmission), and £0.55 million per MW for large scale solar. Comparison with the actual costs reported in audited accounts is stark. The average value of the actual capex costs reported for onshore wind farms completed in 2016-19 was £1.61 million per MW, for offshore wind it was £4.49 million per MW (including transmission) or £3.99 million if the very expensive Hywind project is excluded. For large scale solar the average of actual costs was £0.98 million per MW. Hence, the BEIS assumptions are only 50%-80% of the actual capex costs reported in audited accounts for recently commissioned projects. Since BEIS provides no evidence of any rapid reduction in capex costs per MW of peak capacity, their assumptions reflect little more than wishful thinking. The bias is particularly egregious in the case of offshore wind as most future projects will necessarily be at greater depths and distance from shore, thus incurring significantly higher capex costs for both turbines and transmission.
Opex costs for onshore wind. The BEIS assumptions imply opex costs for onshore wind of £47,000 per MW per year for a wind farm commissioned in 2025. Incredibly, these are assumed to be constant over an operating life of 25 years. Our study, based on audited accounts, shows that actual opex costs for a new onshore wind farm commissioned in 2016 were £77,000 per MW at age 1 and that this will increase to £114,000 at age 15, and £149,000 per MW at age 25 if it were to continue to operate that long (which is very unlikely). The analysis also shows that the initial opex cost for new wind farms has been increasing at 4.3% per year, so the expected opex cost for a wind farm commissioned in 2025 at age 1 would be £112,000 per MW, more than double the BEIS estimate. Overall, the BEIS estimates of opex costs are about one-third of the best estimate based on actual data for the last two decades.
Opex costs for offshore wind. The BEIS assumptions imply opex costs for offshore wind of £109,000 per MW for a wind farm commissioned in 2025, constant over an operating life of 30 years. It is hard to make sense of the BEIS numbers. Their table 2.4 gives a fixed O&M cost of £36,300 per MW per year for 2025. This is implausible if it is supposed to cover Offshore Transmission Operator (OFTO) costs. Indeed, there isn’t a single reference to OFTO transmission costs in the whole document, yet the methodology requires that OFTO costs must be included. Again, our analysis of audited accounts shows that actual opex costs (including OFTO costs) for a new offshore wind farm commissioned in 2018 were £184,000 per MW per year at age one, with an expectation that this will rise to £426,000 per MW per year at age fifteen. Actual offshore opex costs have been increasing at an average of 5.9% per year in real terms for the last two decades, so the lifetime average for a new wind farm commissioned in 2025 would be at least £450,000 per MW per year, or about four times the figure assumed by BEIS.
Opex costs for large solar. The BEIS assumptions imply opex costs for large solar plants of £10,000 per MW per year, constant over an operating lifetime of 35 years. Since most large solar plants were built between 2012 and 2017 the data on lifetime opex costs is limited, but our analysis shows an average of actual operating costs of £19,000 per MW at age one rising to £33,000 per MW at age five. It is unclear whether these costs have been increasing with year of commissioning as well as age. Nonetheless, the pattern is clear. The BEIS assumptions about large solar opex costs are typically one-quarter to one-third of the actual costs incurred by real plants that are operating today.
Load factors for onshore wind. The BEIS estimates assume constant load factors of 34% over relatively long operating lives for new plants. This is implausible, and it would be surprising if even the most committed advocates of renewable generation believed it to be correct. Even the most optimistic academic analyses imply a decline of 1.5% to 2% per year in annual output of onshore wind farms, holding wind conditions constant. Our analysis of the extensive data for Denmark, published together with the present study, shows that while the rate of decline in performance was lower for early generation turbines in the 0.5 MW to 1 MW category, which are no longer installed, the current generation of onshore turbines of greater than 2MW exhibits a rate of decline of about 3% per year. The BEIS failure to recognise any decline in performance is a serious defect in the analysis. There can be no justification for this. BEIS’s own figures show that the actual load factor for onshore wind farms has been constant at about 27% over the last decade after controlling for variations in wind conditions. In practice, what has happened is that the higher load factor for larger turbines at new wind farms, which lies behind their estimate of 34%, has been offset by the decline in performance for older wind farms.
Load factors for offshore wind. BEIS assumes a constant average lifetime load factor of 51% for conventional offshore turbines (i.e. not floating devices such as Hywind). However, for offshore turbines the rate of decline in performance is much worse than for onshore wind, a fact which underlies the rapid increase in opex costs per MW. The average load factor for offshore wind has increased, but this is purely a function of the skewed age distribution in the wind fleet. The BEIS assumption of a 51% load factor relies upon a belief that the future will be radically different from the past. That is unreasonable. The average load factors for offshore wind farms less than five years old in NW Europe mostly fall in the range 40-45%. That is the best they will achieve over their lifetimes and as they age their performance will decline. The advantages of turbine size and hub height referred to in the BEIS analysis are not remotely sufficient to account for the difference between the BEIS assumption of a constant 51%, and the reality of an initial 45% declining steadily over time.
Load factors for large solar. Proponents of large solar generation may be somewhat aggrieved by the BEIS assumption of average lifetime load factor of 11%, which is in fact typical of recent experience. Indeed, solar developers may have a stronger case for arguing that their relatively new technology may allow higher load factors in future. This is partly a matter of definition. Peak output is rarely achieved by most solar plants, whereas wind turbines are increasingly designed to achieve rated output at lower wind speeds, by adjusting the balance of swept area to generator capacity. Nonetheless, United States Energy Information Administration (US EIA) estimates of generation costs have assumed a significant increase in solar load factors for new plants commissioned in 2023-2024 relative to those commissioned in 2019-2020, holding location and solar conditions constant. That may prove to be wrong, but BEIS’s failure to note this possibility, while exaggerating the prospects for wind, brings the peculiar bias of the overall BEIS analysis into sharp focus.
Operating lifetime. The operating lifetime of a new wind farm or solar plant is a complex economic issue and not simply a physical one, since the effect of age on operating costs and performance is critical. The BEIS assumption of an operating life of 25 years for onshore wind is optimistic but not completely outside the bounds of reason. Our analysis suggests that the upper bound with current contractual arrangements and market conditions will be no more than 20 years. On the other hand, assuming an operating life of 30 years for offshore wind – note, with a constant load factor – is completely at odds with any of the actual evidence. The same is true for the 35 year lifetime for large solar plants. After all, even mature and reliable technologies such as Combined Cycle Gas Turbines and super-critical coal plants require major refits after about 20 years.
Future market prices and lifetimes. A possible interpretation of the implausibly long economic lifetimes projected for wind and solar is that BEIS is tacitly assuming that market power prices in the late 2030s will be 3 to 4 times their current level in real terms. Indeed, it is hard to explain the lifetime assumptions on any other basis. If that is indeed BEIS’s assumption, the failure to spell this out in the analysis illustrates the lack of transparency and arbitrary nature of the whole exercise.
Hurdle rates. The BEIS assumptions with regard to hurdle rates are based on a study by Europe Economics carried out in 2018, but only published on the 24th of August as part of the Electricity Generation Costs [2] Let us put aside the problem that even though the Capital Asset Pricing Model used in the study has been adopted by some economists and regulators it has, at best, only an accidental relationship to the way in which real investors determine the hurdle rate of return of investment in generation or other businesses. Still, it is surprising that BEIS appears not to have carried out any kind of sanity check on the numbers in the Europe Economics report. For example, if BEIS had examined a financial model for any of the offshore wind CfD projects in Allocation Round 2 (AR2) or Allocation Round 3 (AR3), they would have discovered that every project would be a financial disaster on the cost of capital assumptions made in the Europe Economics analysis. It would be impossible for Hornsea 2, Moray East or Triton Knoll – all AR2 projects which we have examined in detail – even to cover debt service costs on the BEIS assumptions, let alone produce a reasonable return on equity, if their CfD strike prices are taken at face value. The cost of capital for each project would have to be close to zero simply to cover the announced levels of debt that have been incurred for each project, and even that may not be possible.
Reviewing the deficiencies of the UK government’s latest estimates of generation costs we are left with a puzzle. The assumptions which underpin the BEIS estimates of the cost of generation for wind and solar power are fanciful, and do not withstand even cursory scrutiny; under close analysis they disintegrate and are a disgrace to the civil service and an embarrassment to ministers. Indeed, they are so far from the actual costs incurred by current operators and recorded in audited accounts that they are not worth further consideration, except as evidence for fundamental civil service reform. The review preceding that reform should ask how a heavily funded and staffed government department in a major economy can have strayed so far from the real world in a matter of such importance as energy supply. What on earth is going on?
The behaviour of the commercial entities involved in the renewables sector is also puzzling. If the empirical evidence is so clear, why are large companies committing substantial capital to very large projects that are almost certain to make a loss under anything like current market conditions? There are three factors that may explain this behaviour:
The offshore wind sector is dominated by large companies, often state-controlled, that can deploy large cash flows from existing generation and/or network businesses and are under little pressure to cut costs for their customers or, if state entities, to return cash to their shareholders. Three Scandinavian state-controlled companies – Equinor (formerly Statoil), Ørsted and Vattenfall – are responsible for more than half the current UK offshore wind fleet and have ambitious plans for new projects.
Operators expect to be able to sell on a large portion of the shares in their projects to over-optimistic investors with little appreciation of the risks involved. In addition, projects rely heavily on debt provided by equally naïve lenders.
Operators and financial investors are aware of the risk but expect to be bailed out.
Once economic reality becomes undeniable, there will be a huge lobby to pass on the full costs of offshore wind to either electricity consumers or taxpayers. The obvious instrument is carbon taxation, but the increase required would be very large, and the economic harm would be politically contentious to say the least. Vast bailouts to an industry that has misrepresented its economics, whether knowingly or not, will be extremely unpopular. A government trapped between intense political opposition and the ever-widening ramifications of the financial collapse of the offshore wind sector will behave in ways that cannot be predicted confidently, but investors in renewables should be very nervous.
Gordon Hughes is Professor of Economics at the University of Edinburgh
Dr John Constable is Director of the Renewable Energy Foundation.
Global warming, climate change, all these things are just a dream come true for politicians. I deal with evidence and not with frightening computer models because the seeker after truth does not put his faith in any consensus. The road to the truth is long and hard, but this is the road we must follow. People who describe the unprecedented comfort and ease of modern life as a climate disaster, in my opinion have no idea what a real problem is.
We use cookies to personalise content and ads, to provide social media features and to analyse our traffic. We also share information about your use of our site with our social media, advertising and analytics partners. View more
Cookies settings
Accept
Privacy & Cookie policy
Privacy & Cookies policy
Cookies list
Cookie name
Active
Wer wir sind
Textvorschlag: Die Adresse unserer Website ist: https://climate-science.press.
Kommentare
Textvorschlag: Wenn Besucher Kommentare auf der Website schreiben, sammeln wir die Daten, die im Kommentar-Formular angezeigt werden, außerdem die IP-Adresse des Besuchers und den User-Agent-String (damit wird der Browser identifiziert), um die Erkennung von Spam zu unterstützen.
Aus deiner E-Mail-Adresse kann eine anonymisierte Zeichenfolge erstellt (auch Hash genannt) und dem Gravatar-Dienst übergeben werden, um zu prüfen, ob du diesen benutzt. Die Datenschutzerklärung des Gravatar-Dienstes findest du hier: https://automattic.com/privacy/. Nachdem dein Kommentar freigegeben wurde, ist dein Profilbild öffentlich im Kontext deines Kommentars sichtbar.
Medien
Textvorschlag: Wenn du ein registrierter Benutzer bist und Fotos auf diese Website lädst, solltest du vermeiden, Fotos mit einem EXIF-GPS-Standort hochzuladen. Besucher dieser Website könnten Fotos, die auf dieser Website gespeichert sind, herunterladen und deren Standort-Informationen extrahieren.
Cookies
Textvorschlag: Wenn du einen Kommentar auf unserer Website schreibst, kann das eine Einwilligung sein, deinen Namen, E-Mail-Adresse und Website in Cookies zu speichern. Dies ist eine Komfortfunktion, damit du nicht, wenn du einen weiteren Kommentar schreibst, all diese Daten erneut eingeben musst. Diese Cookies werden ein Jahr lang gespeichert.
Falls du ein Konto hast und dich auf dieser Website anmeldest, werden wir ein temporäres Cookie setzen, um festzustellen, ob dein Browser Cookies akzeptiert. Dieses Cookie enthält keine personenbezogenen Daten und wird verworfen, wenn du deinen Browser schließt.
Wenn du dich anmeldest, werden wir einige Cookies einrichten, um deine Anmeldeinformationen und Anzeigeoptionen zu speichern. Anmelde-Cookies verfallen nach zwei Tagen und Cookies für die Anzeigeoptionen nach einem Jahr. Falls du bei der Anmeldung „Angemeldet bleiben“ auswählst, wird deine Anmeldung zwei Wochen lang aufrechterhalten. Mit der Abmeldung aus deinem Konto werden die Anmelde-Cookies gelöscht.
Wenn du einen Artikel bearbeitest oder veröffentlichst, wird ein zusätzlicher Cookie in deinem Browser gespeichert. Dieser Cookie enthält keine personenbezogenen Daten und verweist nur auf die Beitrags-ID des Artikels, den du gerade bearbeitet hast. Der Cookie verfällt nach einem Tag.
Eingebettete Inhalte von anderen Websites
Textvorschlag: Beiträge auf dieser Website können eingebettete Inhalte beinhalten (z. B. Videos, Bilder, Beiträge etc.). Eingebettete Inhalte von anderen Websites verhalten sich exakt so, als ob der Besucher die andere Website besucht hätte.
Diese Websites können Daten über dich sammeln, Cookies benutzen, zusätzliche Tracking-Dienste von Dritten einbetten und deine Interaktion mit diesem eingebetteten Inhalt aufzeichnen, inklusive deiner Interaktion mit dem eingebetteten Inhalt, falls du ein Konto hast und auf dieser Website angemeldet bist.
Mit wem wir deine Daten teilen
Textvorschlag: Wenn du eine Zurücksetzung des Passworts beantragst, wird deine IP-Adresse in der E-Mail zur Zurücksetzung enthalten sein.
Wie lange wir deine Daten speichern
Textvorschlag: Wenn du einen Kommentar schreibst, wird dieser inklusive Metadaten zeitlich unbegrenzt gespeichert. Auf diese Art können wir Folgekommentare automatisch erkennen und freigeben, anstatt sie in einer Moderations-Warteschlange festzuhalten.
Für Benutzer, die sich auf unserer Website registrieren, speichern wir zusätzlich die persönlichen Informationen, die sie in ihren Benutzerprofilen angeben. Alle Benutzer können jederzeit ihre persönlichen Informationen einsehen, verändern oder löschen (der Benutzername kann nicht verändert werden). Administratoren der Website können diese Informationen ebenfalls einsehen und verändern.
Welche Rechte du an deinen Daten hast
Textvorschlag: Wenn du ein Konto auf dieser Website besitzt oder Kommentare geschrieben hast, kannst du einen Export deiner personenbezogenen Daten bei uns anfordern, inklusive aller Daten, die du uns mitgeteilt hast. Darüber hinaus kannst du die Löschung aller personenbezogenen Daten, die wir von dir gespeichert haben, anfordern. Dies umfasst nicht die Daten, die wir aufgrund administrativer, rechtlicher oder sicherheitsrelevanter Notwendigkeiten aufbewahren müssen.
Wohin deine Daten gesendet werden
Textvorschlag: Besucher-Kommentare könnten von einem automatisierten Dienst zur Spam-Erkennung untersucht werden.


