

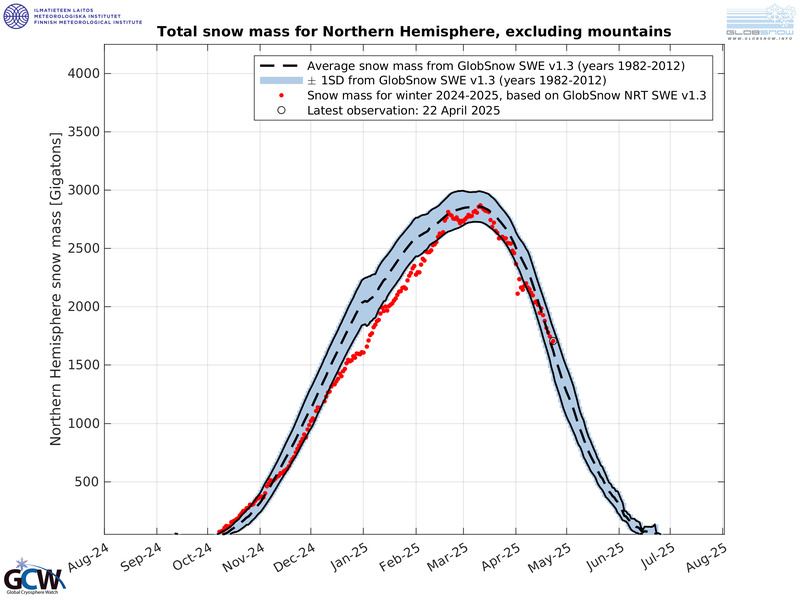
Following on from one of its snowiest winters on record in 2019-20 comes the first 2020-21 data-points from the Finnish Meteorological Institute (FMI). What they clearly reveal is that the Northern Hemisphere is at it again, continuing the trend of growth observed in recent years.
Despite decades of doom-and-gloom prophecies and fear-mongering claptrap, the Northern Hemisphere continues to GAIN “snow mass” at a rate comfortably above the 1982-2012 average:
Furthermore, the latest data point (from Oct, 16) has yet to include the record-breaking accumulations across the Rockies and Northern Plains over the weekend, as well as the “unusually” early falls witnessed in western Canada, and the recent dumps in the European Alps.
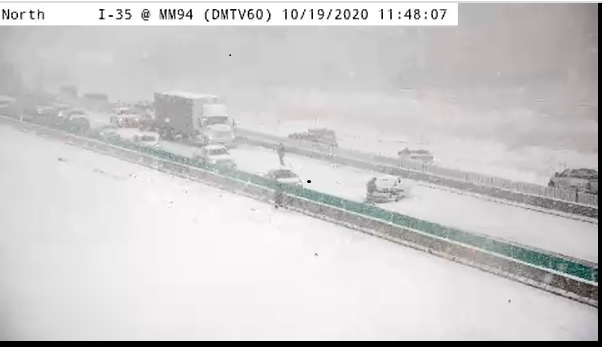
Monday’s “surprise” 9 inches of snow in central Iowa also isn’t included in the plotted points above. According to official NWS forecasts, Des Moines was set to receive “light flurries.” Indeed, the light flurries hit at about 8:30 a.m., but then conditions in the metro quickly intensified as the morning progressed. It was around 11:45 a.m. when central Iowans received a “Snow Squall Warning” alert on their cell phones. The message from the NWS warned of whiteout conditions and icy roads and ended emphatically, urging drivers to “Slow down!”
By the end of the day, the squall had dropped three-quarters of a foot in northern Polk County.
https://platform.twitter.com/embed/index.html?dnt=true&embedId=twitter-widget-0&frame=false&hideCard=false&hideThread=false&id=1318236536152985600&lang=de&origin=https%3A%2F%2Fwordpress.com%2Fread%2Ffeeds%2F85002459%2Fposts%2F2977523457&theme=light&widgetsVersion=ed20a2b%3A1601588405575&width=550px
Data from Rutgers Global Snow Lab backs-up the wintry start to the season.
Feel free to compare daily snow cover to previous years for yourself over at climate.rutgers.edu — but to my eye, the NH hasn’t had this widespread of a covering on “Day 294” since the dataset began back in 1999:

Greenland
Also awaiting to be plotted on the FMI chart are the monster GAINS witnessed on the Greenland Ice Sheet over the past 5 days. Across the island, this season’s trend is continuing –even increasing– the flip to growth that began back in 2016 (more on that here).
Looking at the latest data (shown below) coming from the Danish Meteorological Institute (DMI), this year’s growth, although astonishing, should come as no surprise to those who track the activity of the sun.

This is how glaciers form.
This is also how ice ages begin.
I look forward to hearing the alarmists’ spin on these remarkable GAINS.

I expect climate alarmists will either lie about Greenland or ignore it altogether and instead concentrate on the Arctic. Temperatures around the northern pole do indeed appear to be increasing, slightly — however, and as I’ve retyped, regurgitated, and reexplained many a time on Electroverse: Grand Solar Minimum’s play a significant role in producing extreme “ice-age” type cold weather events while, paradoxically, at the same time causing regions like Alaska and the northernmost Arctic (among others) to warm — this aligns perfectly with what we’re seeing today, and also neatly ties-in with NASA’s ‘Maunder Minimum Temperature Reconstruction Map’:

While the Arctic warms, the mid-latitudes –where the majority of us humans reside and grow our crops– cools. The AGW cabal wants us to believe that all that polar cold simply ups and vanishes, but science is no magic trick–the Arctic chill has to go somewhere, and a weak & wavy meridional jet stream flow (caused by historically low solar activity) is diverting it south. This explains why continents like the North America appear immune to global warming, it’s why they’re showing a cooling trend in recent years.
https://electroverse.net/why-is-north-america-immune-to-global-warming/embed/#?secret=1dRP8MqPtE
Don’t fall for bogus political agendas.
The COLD TIMES are returning, the mid-latitudes are REFREEZING in line with historically low solar activity, cloud-nucleating Cosmic Rays, and a meridional jet stream flow.
Both NOAA and NASA appear to agree, if you read between the lines, with NOAA saying we’re entering a ‘full-blown’ Grand Solar Minimum in the late-2020s, and NASA seeing this upcoming solar cycle (25) as “the weakest of the past 200 years”, with the agency correlating previous solar shutdowns to prolonged periods of global cooling here.
Furthermore, we can’t ignore the slew of new scientific papers stating the immense impact The Beaufort Gyre could have on the Gulf Stream, and therefore the climate overall.


Prepare accordingly— learn the facts, relocate if need be, and grow your own.
Social Media channels are restricting Electroverse’s reach: Twitter are purging followers while Facebook are labeling posts as “false” and have slapped-on crippling page restrictions.
Be sure to subscribe to receive new post notifications by email (the box is located in the sidebar >>> or scroll down if on mobile).
And/or become a Patron, by clicking here: patreon.com/join/electroverse, and/or consider “allowing ads” for http://www.electroverse.net if you use a blocker.
The site receives ZERO funding, and never has. So any way you can, help us spread the message so others can survive and thrive in the coming times.
Grand Solar Minimum + Pole Shift
NASA has been warning of a Grand Solar Minimum (GSM) for the past Decade
The post Northern Hemisphere Snow Mass Above Average + Greenland Ice Sheet’s Astonishing Gains Continue appeared first on Electroverse.

You must be logged in to post a comment.