


THIS POST IS A CRITICAL REVIEW OF A PNAS PAPER AND AN EARTHSKY ARTICLE ABOUT THAT PAPER DESCRIBING HOW ANTHROPOGENIC GLOBAL WARMING THREATENS THE PINE ISLAND GLACIER AND THE THWAITES GLACER IN WEST ANTARCTICA. (Maps above show their location).
LINK TO SOURCE: THE PNAS PAPER: https://www.pnas.org/content/117/40/24735 . THE EARTHSKY ARTICLE ABOUT THE PAPER: https://earthsky.org/earth/worsening-rifts-fractures-2-important-antarctic-glaciers
THE PNAS PAPER:
Damage accelerates ice shelf instability and mass loss in Amundsen Sea Embayment. Sainan Sun, Christopher Shuman, Bert Wouters, Frank Pattyn, Jan Wuite, Etienne Berthier, Thomas Nagler
PNAS October 6, 2020 117 (40) 24735-24741; September 2020; https://doi.org/10.1073/pnas.1912890117.
Significance: Pine Island Glacier and Thwaites Glacier in the Amundsen Sea Embayment are among the fastest changing outlet glaciers in Antarctica. Yet, projecting the future of these glaciers remains a major uncertainty for sea level rise. Here we use satellite imagery to show the development of damage areas with crevasses and open fractures on Pine Island and Thwaites ice shelves. These damage areas are first signs of their structural weakening as they precondition these ice shelves for disintegration. Model results that include the damage mechanism highlight the importance of damage for ice shelf stability, grounding line retreat, and future sea level contributions from Antarctica. Moreover, they underline the need for incorporating damage processes in models to improve sea level rise projections.
ABSTRACT: Pine Island Glacier and Thwaites Glacier in the Amundsen Sea Embayment are among the fastest changing outlet glaciers in West Antarctica with large consequences for global sea level. Yet, assessing how much and how fast both glaciers will weaken if these changes continue remains a major uncertainty as many of the processes that control their ice shelf weakening and grounding line retreat are not well understood. Here, we combine multisource satellite imagery with modeling to uncover the rapid development of damage areas in the shear zones of Pine Island and Thwaites ice shelves. These damage areas consist of highly crevassed areas and open fractures and are first signs that the shear zones of both ice shelves have structurally weakened over the past decade. Idealized model results reveal moreover that the damage initiates a feedback process where initial ice shelf weakening triggers the development of damage in their shear zones, which results in further speedup, shearing, and weakening, hence promoting additional damage development. This damage feedback potentially preconditions these ice shelves for disintegration and enhances grounding line retreat. The results of this study suggest that damage feedback processes are key to future ice shelf stability, grounding line retreat, and sea level contributions from Antarctica. Moreover, they underline the need for incorporating these feedback processes, which are currently not accounted for in most ice sheet models, to improve sea level rise projections.
THE EARTHSKY ARTICLE:
Satellite imagery has revealed that 2 of the fastest-changing glaciers in Antarctica – Pine Island and Thwaites – are fracturing and weakening faster than ever, a step towards the glaciers’ disintegrating and causing sea levels to rise dramatically. The ice sheets of both glaciers can be seen fracturing and tearing apart. Satellite imagery has revealed fracturing and weakening of two of the fastest-changing glaciers on the Antarctic continent, the Pine Island and Thwaites glaciers. According to a new study, published October 6, 2020 in the peer-reviewed Proceedings of the National Academy of Sciences, the two glaciers are disintegrating faster than ever, and are responsible for a substantial 5% of global sea level rise. Together, the two glaciers, in an area of Antarctica called the Amundsen Sea Embayment, form an area of flowing ice the size of Norway, and hold enough water to raise global sea levels by over a meter. In recent decades, both of the glaciers have distinctly changed in form along with changing atmospheric and oceanic conditions, with the warming oceans causing ice shelves to melt, thin, and retreat. Using imaging data from several different satellites for from 1997-2016, the researchers looked at how the glacier and ice shelf elevation had changed over this time, and changes in the speed of moving ice. They found structural damage at what’s called the ‘shear margins’ of the glaciers’ ice shelves, where the ice transitions from fast-moving to slow-moving: large crevasses, rifts and open fractures that indicate that the ice shelves are slowly tearing apart. Stef Lhermitte of Delft University of Technology in the Netherlands is lead author of the new study. He said in a statement: Currently, the ice shelves are a little like a slow car in traffic: they force anything behind them to slow down. Once they’re removed, ice sitting further inland will be able to speed up, which in turn will cause sea levels to rise even faster. Animation of a transverse crack appearing in a large ice sheet. Rift evolution across the ice tongue – a long, narrow ice sheet extending seaward – of Antarctica’s Pine Island glacier (PIG) in September and October of 2018, as seen by the Copernicus Sentinel-1 mission. The video shows the emergence of an ice sheet rift in a region that was previously stable. Image via ESA. The team modeled the potential impact of the damaged shear margins. Study co-author Thomas Nagler of ENVEO in Austria, said: This fracturing appears to kick off a feedback process – it preconditions the ice shelves to disintegrate. As the glaciers fracture at their weak points this damage speeds up, spreads, and weakens more of the ice shelves, causing further deterioration – and making it more likely that the shelves will start crumbling apart even faster. As the ice shelves become increasingly damaged, the glaciers lose mass, and their ‘grounding lines’ – the region where ice sheets become buoyant enough to detach from the seafloor and float – retreat. Overall, the researchers said, damage feedback processes appear to be a key factor in the future stability of Antarctica’s ice shelves, and, in turn, in how fast the continent’s glaciers melt and cause global sea levels to rise. We know that a significant amount of glacial ice in West Antarctica is currently being affected by climate change. In fact, a recent study found 24% of this ice to be rapidly thinning and unstable. These new results underline just how quickly this damage is occurring, and reveal that Pine Island and Thwaites glaciers are more vulnerable than ever before. Bottom line: A video shows the evolution of damage to Antarctica’s Pine Island and Thwaites glaciers from October 2014 to July 2020. The video, made using satellite images, shows the ice sheets of both glaciers fracturing and tearing apart.
CRITICAL COMMENTARY
In a related post on the geological features of West Antarctica: [LINK] , we show that the West Antarctica region where The Thwaites and Pine Island Glaciers are located sits atop the West Antarctic Rift System (WARS). This long rift system cuts across most of West Antarctica. It is is more than 7 million square km measuring 6,440 by 1127km. The West Antarctic Rift System is home to the Marie Byrd Mantle Plume Hotspot and more than 100 active volcanoes. A brief description of rifting is provided below {courtesy of the Engineering & Geosciences department of James Madison University JMU.EDU.}
A Divergent plate boundary is where two lithospheric plates are being pulled apart by enormous amounts of energy in a geological process called rifting that creates new oceanic lithosphere. As the plates are pulled apart, Magma oozes up from the mantle. When rifting is complete a new divergent plate boundary and a new ocean basin is created. Rifting is initiated by magma plumes rising from deep in the mantle toward the surface. As the plume rises it heats the overlying lithosphere causing it to swell upward to create a hot spot. The magma that reaches the surface creates volcanoes.
Eventually a long string of volcanos may form. When a mantle plume reaches the base of the continental lithosphere it spreads out creating a pond of magma. The overlying lithosphere heats and swells upward to form the hot spot, about 1000 km in diameter and 3 to 4 km above sea level. As the hot spot dome swells its upper surface stretches until the crust cracks and creates faults.
All of West Antarctica is geologically active in this manner and the Pine island and Thwaites glaciers are located within the Marie Byrd Mantle Plume Hotspot which in turn is located within the West Antarctic Rift System.
THE WEST ANTARCTIC RIFT SYSTEM (WARS)


THE MARIE BYRD MANTLE PLUME HOT SPOT

In the study of ice melt events in West Antarctica, these geological features and their associated volcanic activity underneath the Thwaites and Pine Island glaciers cannot be ignored in favor of an exclusive consideration of anthropogenic global warming by way of the greenhouse effect of atmospheric carbon dioxide thought to have been dangerously increased by fossil fuel emissions.
As shown in a related post: [LINK] , in the period 1979 to 2019, the rate of warming in global mean temperature when averaged across all 12 calendar months was 1.3C per century with the rates for the individual calendar months ranging from 1.1C/century for the months of May and June to 1.55C/century for September and October.
In the Tropics, the warming rates are somewhat lower than at an average of 1.2C per century for all 12 calendar months with the corresponding monthly rates ranging from 0.9C for March to 1.7C for July.
In the North, the warming rate is significantly higher for the Arctic region where the annual average rate is 2.57C per century and the monthly rates range from 1.4C for July to 3.8C for April. But a very different warming situation is found in the other polar region.
For the Antarctic South Polar Region we find a mean annual warming rate of 0.16C per century with the rates for the calendar months ranging from the winter months of June and July that are cooling at a rate of 1.7C per century to the summer month of November that is warming at 2.5C per century. Th six calendar months from April to September show cooling and the other six calendar months from October to March show warming. Since ice melt events in Antarctica are not seasonal, the relevant warming rate for that consideration is the very low annual mean rate of 0.16C per century. This anthropogenic global warming rate for the South Polar region does not indicate that global warming there is the driver of ice melt events in Antarctica.
Accordingly, climate science explains ice melt events in Antarctica in terms of anthropogenic global warming by way of ocean currents that bring warmth from the Tropics to the Antarctic. Ice melt events are explained in terms of the relative warmth of the Antarctic Deep Circumpolar Current and the warmth of the Deep Circumpolar current is explained in terms of heat transfer from the Tropics to the Antarctic by way of ocean currents. Ice melt events in Antarctica are then attributed to anthropogenic global warming on this basis.
![Turbulence in a climate model simulation of the Antarctic Circumpolar Current [OC] - GIF on Imgur](https://i0.wp.com/i.imgur.com/Tp3aDb2.gif?w=723&ssl=1)
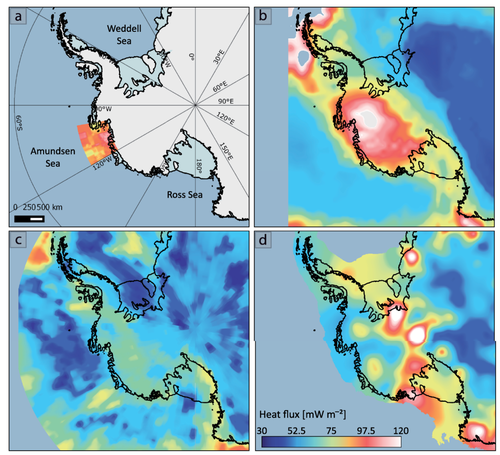
There are two difficult and unresolved issues for the climate change theory of ice melt events in Antarctica in this manner. The first issue is that significant evidence exists not only for the for the relative warmth of the Deep Circumpolar Current but for ice melt events themselves in terms of geological heat implied by the geological features of West Antarctica described above. The relevant geothermal heat map is shown below (courtesy of Martos etal 2017) . A bibliography on this topic follows the Martos geothermal heat map.
CONCLUSION: The claim that the observed ice melt events can be attributed to anthropogenic global warming and that such melt events can then be forecast as a predicter of the sea level rise of anthropogenic global warming is not possible in light of the complex episodic and localized event nature of ice melt in Antarctica and the clearer explanation of this phenomenon in terms of the known geological features of the region.
The Martos etal geothermal heat map. .


ANTARCTICA GEOTHERMAL HEAT FLUX BIBLIOGRAPHY
- Scambos, Ted A., et al. “The link between climate warming and break-up of ice shelves in the Antarctic Peninsula.” Journal of Glaciology 46.154 (2000): 516-530. A review of in situ and remote-sensing data covering the ice shelves of the Antarctic Peninsula provides a series of characteristics closely associated with rapid shelf retreat: deeply embayed ice fronts; calving of myriad small elongate bergs in punctuated events; increasing flow speed; and the presence of melt ponds on the ice-shelf surface in the vicinity of the break-ups. As climate has warmed in the Antarctic Peninsula region, melt-season duration and the extent of ponding have increased. Most break-up events have occurred during longer melt seasons, suggesting that meltwater itself, not just warming, is responsible. Regions that show melting without pond formation are relatively unchanged. Melt ponds thus appear to be a robust harbinger of ice-shelf retreat. We use these observations to guide a model of ice-shelf flow and the effects of meltwater. Crevasses present in a region of surface ponding will likely fill to the brim with water. We hypothesize (building on Weertman (1973), Hughes (1983) and Van der Veen (1998)) that crevasse propagation by meltwater is the main mechanism by which ice shelves weaken and retreat. A thermodynamic finite-element model is used to evaluate ice flow and the strain field, and simple extensions of this model are used to investigate crack propagation by meltwater. The model results support the hypothesis.
- Convey, P., et al. “The flora of the South Sandwich Islands, with particular reference to the influence of geothermal heating.” Journal of Biogeography 27.6 (2000): 1279-1295. Data obtained in 1997 are combined with updated records from the only previous survey (in 1964) to provide a baseline description of the flora of the archipelago, which currently includes 1 phanerogam, 38 mosses, 11 liverworts, 5 basidiomycete fungi, 41 lichenised fungi and 16 diatoms with, additionally, several taxa identified only to genus. Major elements of the moss and liverwort floras are composed of South American taxa (32% and 73%, respectively), with a further 45% of mosses having bipolar or cosmopolitan distributions. These two groups show low levels of Antarctic endemicity (11% and 18%, respectively). In contrast, 52% of lichens and 80% of basidiomycete fungi are endemic to the Antarctic. A further 36% of lichens are bipolar/cosmopolitan, with only 5% of South American origin. The flora of the South Sandwich Islands is clearly derived from those of other Antarctic zones. The flora of unheated ground is closely related to that of the maritime Antarctic, although with a very limited number of species represented. That of heated ground contains both maritime and sub‐Antarctic elements, confirming the importance of geothermal heating for successful colonisation of the latter group. The occurrence of several maritime Antarctic species only on heated ground confirms the extreme severity of the archipelago’s climate in comparison with well‐studied sites much further south in this biogeographical zone.
- Smith, RI Lewis. “The bryophyte flora of geothermal habitats on Deception Island, Antarctica.” The Journal of the Hattori Botanical Laboratory 97 (2005): 233-248. Deception Island is one of the most volcanically active sites south of 60°S. Between 1967 and 1970 three major eruptions devastated large expanses of the landscape and its predominantly cryptogamic vegetation. Since 1970 extensive recolonisation has occurred on the more stable surfaces. Unheated ground supports several bryophyte and lichen communities typical of much of the maritime Antarctic, but geothermal habitats possess remarkable associations of bryophytes, many of the species being unknown or very rare elsewhere in the Antarctic. Nine geothermal sites were located and their vegetation investigated in detail. Communities associated with more transient sites have disappeared when the geothermal activity ceased. Mosses and liverworts occur to within a few centimetres of fumarole vents where temperatures reach 90-95℃, while temperatures within adjacent moss turf can reach 35-50℃ or more and remain consistently between 25 and 45℃. Most of the bryoflora has a Patagonian-Fuegian provenance and it is presumed that, unlike most species, the thermophiles are not pre-adapted to the Antarctic environment, being able to colonise only where the warm and humid conditions prevail.
- Vieira, Gonçalo, et al. “Geomorphological observations of permafrost and ground-ice degradation on Deception and Livingston Islands, Maritime Antarctica.” (2008): 1939-1844. The Antarctic Peninsula is experiencing one of the fastest increases in mean annual air temperatures (ca. 2.5oC in the last 50 years) on Earth. If the observed warming trend continues as indicated by climate models, the region could suffer widespread permafrost degradation. This paper presents field observations of geomorphological features linked to permafrost and ground-ice degradation at two study areas: northwest Hurd Peninsula (Livingston Island) and Deception Island along the Antarctic Peninsula. These observations include thermokarst features, debris flows, active-layer detachment slides, and rockfalls. The processes observed may be linked not only to an increase in temperature, but also to increased rainfall, which can trigger debris flows and other processes. On Deception Island some thermokarst (holes in the ground produced by the selective melting of permafrost) features may be related to anomalous geothermal heat flux from volcanic activity.
- Mulvaney, Robert, et al. “Recent Antarctic Peninsula warming relative to Holocene climate and ice-shelf history.” Nature 489.7414 (2012): 141-144. Rapid warming over the past 50 years on the Antarctic Peninsula is associated with the collapse of a number of ice shelves and accelerating glacier mass loss1,2,3,4,5,6,7. In contrast, warming has been comparatively modest over West Antarctica and significant changes have not been observed over most of East Antarctica8,9, suggesting that the ice-core palaeoclimate records available from these areas may not be representative of the climate history of the Antarctic Peninsula. Here we show that the Antarctic Peninsula experienced an early-Holocene warm period followed by stable temperatures, from about 9,200 to 2,500 years ago, that were similar to modern-day levels. Our temperature estimates are based on an ice-core record of deuterium variations from James Ross Island, off the northeastern tip of the Antarctic Peninsula. We find that the late-Holocene development of ice shelves near James Ross Island was coincident with pronounced cooling from 2,500 to 600 years ago. This cooling was part of a millennial-scale climate excursion with opposing anomalies on the eastern and western sides of the Antarctic Peninsula. Although warming of the northeastern Antarctic Peninsula began around 600 years ago, the high rate of warming over the past century is unusual (but not unprecedented) in the context of natural climate variability over the past two millennia. The connection shown here between past temperature and ice-shelf stability suggests that warming for several centuries rendered ice shelves on the northeastern Antarctic Peninsula vulnerable to collapse. Continued warming to temperatures that now exceed the stable conditions of most of the Holocene epoch is likely to cause ice-shelf instability to encroach farther southward along the Antarctic Peninsula.
- Fraser, Ceridwen I., et al. “Geothermal activity helps life survive glacial cycles.” Proceedings of the National Academy of Sciences 111.15 (2014): 5634-5639. The evolution and maintenance of diversity through cycles of past climate change have hinged largely on the availability of refugia (places where life can survive through a period of unfavorable conditions such as glaciation). Geothermal refugia may have been particularly important for survival through past glaciations. Our spatial modeling of Antarctic biodiversity indicates that some terrestrial groups likely survived throughout intense glacial cycles on ice-free land or in sub-ice caves associated with areas of geothermal activity, from which recolonization of the rest of the continent took place. These results provide unexpected insights into the responses of various species to past climate change and the importance of geothermal regions in promoting biodiversity. Furthermore, they indicate the likely locations of biodiversity “hotspots” in Antarctica, suggesting a critical focus for future conservation efforts.
- An, Meijian, et al. “Temperature, lithosphere‐asthenosphere boundary, and heat flux beneath the Antarctic Plate inferred from seismic velocities.” Journal of Geophysical Research: Solid Earth 120.12 (2015): 8720-8742. We estimate the upper mantle temperature of the Antarctic Plate based on the thermoelastic properties of mantle minerals and S velocities using a new 3‐D shear velocity model, AN1‐S. Crustal temperatures and surface heat fluxes are then calculated from the upper mantle temperature assuming steady state thermal conduction. The temperature at the top of the asthenosphere beneath the oceanic region and West Antarctica is higher than the dry mantle solidus, indicating the presence of melt. From the temperature values, we generate depth maps of the lithosphere‐asthenosphere boundary and the Curie temperature isotherm. The maps show that East Antarctica has a thick lithosphere similar to that of other stable cratons, with the thickest lithosphere (~250 km) between Domes A and C. The thin crust and lithosphere beneath West Antarctica are similar to those of modern subduction‐related rift systems in East Asia. A cold region beneath the Antarctic Peninsula is similar in spatial extent to that of a flat‐subducted slab beneath the southern Andes, indicating a possible remnant of the Phoenix Plate, which was subducted prior to 10 Ma. The oceanic lithosphere generally thickens with increasing age, and the age‐thickness correlation depends on the spreading rate of the ridge that formed the lithosphere. Significant flattening of the age‐thickness curves is not observed for the mature oceanic lithosphere of the Antarctic Plate.
- Dziadek, Ricarda, et al. “Geothermal heat flux in the Amundsen Sea sector of West Antarctica: New insights from temperature measurements, depth to the bottom of the magnetic source estimation, and thermal modeling.” Geochemistry, Geophysics, Geosystems 18.7 (2017): 2657-2672. [FULL TEXT] Focused research on the Pine Island and Thwaites glaciers, which drain the West Antarctic Ice Shelf (WAIS) into the Amundsen Sea Embayment (ASE), revealed strong signs of instability in recent decades that result from variety of reasons, such as inflow of warmer ocean currents and reverse bedrock topography, and has been established as the Marine Ice Sheet Instability hypothesis. Geothermal heat flux (GHF) is a poorly constrained parameter in Antarctica and suspected to affect basal conditions of ice sheets, i.e., basal melting and subglacial hydrology. Thermomechanical models demonstrate the influential boundary condition of geothermal heat flux for (paleo) ice sheet stability. Due to a complex tectonic and magmatic history of West Antarctica, the region is suspected to exhibit strong heterogeneous geothermal heat flux variations. We present an approach to investigate ranges of realistic heat fluxes in the ASE by different methods, discuss direct observations, and 3‐D numerical models that incorporate boundary conditions derived from various geophysical studies, including our new Depth to the Bottom of the Magnetic Source (DBMS) estimates. Our in situ temperature measurements at 26 sites in the ASE more than triples the number of direct GHF observations in West Antarctica. We demonstrate by our numerical 3‐D models that GHF spatially varies from 68 up to 110 mW m−2.
- Martos, Yasmina M., et al. “Heat flux distribution of Antarctica unveiled.” Geophysical Research Letters 44.22 (2017): 11-417. [FULL TEXT] Antarctica is the largest reservoir of ice on Earth. Understanding its ice sheet dynamics is crucial to unraveling past global climate change and making robust climatic and sea level predictions. Of the basic parameters that shape and control ice flow, the most poorly known is geothermal heat flux. Direct observations of heat flux are difficult to obtain in Antarctica, and until now continent‐wide heat flux maps have only been derived from low‐resolution satellite magnetic and seismological data. We present a high‐resolution heat flux map and associated uncertainty derived from spectral analysis of the most advanced continental compilation of airborne magnetic data. Small‐scale spatial variability and features consistent with known geology are better reproduced than in previous models, between 36% and 50%. Our high‐resolution heat flux map and its uncertainty distribution provide an important new boundary condition to be used in studies on future subglacial hydrology, ice sheet dynamics, and sea level change.
- Burton‐Johnson, Alex, et al. “A new heat flux model for the Antarctic Peninsula incorporating spatially variable upper crustal radiogenic heat production.” Geophysical Research Letters 44.11 (2017): 5436-5446. A new method for modeling heat flux shows that the upper crust contributes up to 70% of the Antarctic Peninsula’s subglacial heat flux and that heat flux values are more variable at smaller spatial resolutions than geophysical methods can resolve. Results indicate a higher heat flux on the east and south of the Peninsula (mean 81 mW m−2) where silicic rocks predominate, than on the west and north (mean 67 mW m−2) where volcanic arc and quartzose sediments are dominant. While the data supports the contribution of heat‐producing element‐enriched granitic rocks to high heat flux values, sedimentary rocks can be of comparative importance dependent on their provenance and petrography. Models of subglacial heat flux must utilize a heterogeneous upper crust with variable radioactive heat production if they are to accurately predict basal conditions of the ice sheet. Our new methodology and data set facilitate improved numerical model simulations of ice sheet dynamics.
- Schroeder, Dustin M., et al. „Evidence for elevated and spatially variable geothermal flux beneath the West Antarctic Ice Sheet.“ Proceedings of the National Academy of Sciences 111.25 (2014): 9070-9072. SIGNIFICANCE: Thwaites Glacier is one of the West Antarctica’s most prominent, rapidly evolving, and potentially unstable contributors to global sea level rise. Uncertainty in the amount and spatial pattern of geothermal flux and melting beneath this glacier is a major limitation in predicting its future behavior and sea level contribution. In this paper, a combination of radar sounding and subglacial water routing is used to show that large areas at the base of Thwaites Glacier are actively melting in response to geothermal flux consistent with rift-associated magma migration and volcanism. This supports the hypothesis that heterogeneous geothermal flux and local magmatic processes could be critical factors in determining the future behavior of the West Antarctic Ice Sheet. ABSTRACT: Heterogeneous hydrologic, lithologic, and geologic basal boundary conditions can exert strong control on the evolution, stability, and sea level contribution of marine ice sheets. Geothermal flux is one of the most dynamically critical ice sheet boundary conditions but is extremely difficult to constrain at the scale required to understand and predict the behavior of rapidly changing glaciers. This lack of observational constraint on geothermal flux is particularly problematic for the glacier catchments of the West Antarctic Ice Sheet within the low topography of the West Antarctic Rift System where geothermal fluxes are expected to be high, heterogeneous, and possibly transient. We use airborne radar sounding data with a subglacial water routing model to estimate the distribution of basal melting and geothermal flux beneath Thwaites Glacier, West Antarctica. We show that the Thwaites Glacier catchment has a minimum average geothermal flux of ∼114 ± 10 mW/m2 with areas of high flux exceeding 200 mW/m2 consistent with hypothesized rift-associated magmatic migration and volcanism. These areas of highest geothermal flux include the westernmost tributary of Thwaites Glacier adjacent to the subaerial Mount Takahe volcano and the upper reaches of the central tributary near the West Antarctic Ice Sheet Divide ice core drilling site. [LINK TO FULL TEXT]

LEFT: Bed topography of the West Antarctic Ice Sheet and Amundsen Sea Embayment. MIDDLE: Subglacial hydrologic potential (13) for a distributed water system in the upstream region of the Thwaites Glacier catchment (black boundary). RIGHT: Collection of subglacial water routing models that best fit the observed radar bed echo strength distribution

Minimum geothermal flux and basal melt values required to reproduce the observed relative bed echo strengths (Fig. 2A) with subglacial water routing models (13, 27) (Fig. 1C) using the total melt water from an ice sheet model for the upstream portion of the Thwaites Glacier catchment (9). The minimum average inferred flux is ∼114 ± 10 mW/m2. High-flux areas exceed 200 mW/m2. A indicates the Mount Takahe volcano. B indicates the WAIS Divide ice core drilling site. High-melt areas are indicated by C in the westernmost tributary, D adjacent to the Crary mountains, and E in the upper portion of the central tributaries (8). Triangles show areas where radar-inferred melt anomalies exceed those generated by ice dynamics (friction and advection) (9) and inferred geothermal flux exceeds 150 mW/m2 (dark magenta) and 200 mW/m2 (light magenta). Bed topography (12) contour interval for Antarctica is 180 m. The upstream region of the Thwaites Glacier catchment contains several areas of strong relative bed echoes indicating larger quantities of subglacial water. The distribution of melt and geothermal flux includes several regions with high melt that are closely related to rift structure and associated volcanism. These include the entire westernmost tributary (Fig. 3, location C) that flanks Mount Takahe (Fig. 3, location A), a subaerial volcano active in the Quaternary (28, 29), and several high-flux areas across the catchment adjacent to topographic features that are hypothesized to be volcanic in origin as seen in the image above and as described in Bahrendt 1998 and Bahrendt 2013, and Joughin 2009. We also observe high geothermal flux in the upper reaches of the central tributaries that are relatively close to the site of the WAIS Divide ice core where unexpectedly high melt and geothermal flux have been estimated. We estimate a minimum average geothermal flux value of about 114 mW/m2 with a notional uncertainty of about 10 mW/m2 for the Thwaites Glacier catchment with areas exceeding 200 mW/m2. These values are likely underestimates due to the low uniform geothermal flux value used in the ice sheet model and the compensating effect of enhanced vertical advection of cold shallow ice in high-melt areas. Note that this latter effect also predicts a subtle gradient of underestimated flux from the interior to the trunk as fast flow and associated frictional melting increases.
12. Behrendt, John C., et al. „Aeromagnetic evidence for a volcanic caldera complex beneath the divide of the West Antarctic Ice Sheet.“ Geophysical Research Letters 25.23 (1998): 4385-4388. A 1995–96 aeromagnetic survey over part of the Sinuous Ridge (SR) beneath the West Antarctic Ice Sheet (WAIS) divide shows a 70‐km diameter circular pattern of 400–1200‐nT anomalies suggesting one of the largest volcanic caldera complexes on earth. Radar‐ice‐sounding (RIS) shows the northern part of this pattern overlies the SR, and extends south over the Bentley Subglacial Trench (BST). Modeled sources of all but one the caldera anomalies are at the base of <1–2‐km thick ice and their volcanic edifices have been glacially removed. The exception is a 700‐m high, 15‐km wide volcano“ producing an 800‐nT anomaly over the BST. Intrusion of this volcano beneath 3 km of ice probably resulted in pillow basalt rather than easily removed hyaloclastite erupted beneath thinner ice. The background area (−300 to −500‐nT) surrounding the caldera is possibly caused by a shallow Curie isotherm. We suggest uplift of the SR forced the advance of the WAIS.
13. Behrendt, John C. „The aeromagnetic method as a tool to identify Cenozoic magmatism in the West Antarctic Rift System beneath the West Antarctic Ice Sheet—A review; Thiel subglacial volcano as possible source of the ash layer in the WAISCORE.“ Tectonophysics 585 (2013): 124-136. The West Antarctic Ice Sheet (WAIS) sits on the volcanically active West Antarctic Rift System (WARS). The aeromagnetic method has been the most useful geophysical tool for identification of subglacial volcanic rocks, since 1959–64 surveys, particularly combined with 1978 radar ice-sounding. The unique 1991–97 Central West Antarctica (CWA) aerogeophysical survey covering 354,000 km2 over the WAIS, (5-km line-spaced, orthogonal lines of aeromagnetic, radar ice-sounding, and aerogravity measurements), still provides invaluable information on subglacial volcanic rocks, particularly combined with the older aeromagnetic profiles. These data indicate numerous 100–>1000 nT, 5–50-km width, shallow-source, magnetic anomalies over an area greater than 1.2 × 10⁶ km2, mostly from subglacial volcanic sources. I interpreted the CWA anomalies as defining about 1000 “volcanic centers” requiring high remanent normal magnetizations in the present field direction. About 400 anomaly sources correlate with bed topography. At least 80% of these sources have less than 200 m relief at the WAIS bed. They appear modified by moving ice, requiring a younger age than the WAIS (about 25 Ma). Exposed volcanoes in the WARS are < 34 Ma, but at least four are active. If a few buried volcanic centers are active, subglacial volcanism may well affect the WAIS regime. Aero-geo-physical data (Blankenship et al., 1993, Mt. Casertz; Corr and Vaughan, 2008, near Hudson Mts.) indicated active subglacial volcanism. Magnetic data indicate a caldera and a surrounding “low” in the WAISCORE vicinity possibly the result of a shallow Curie isotherm. High heat flow reported from temperature logging in the WAISCORE (Conway et al., 2011; Clow, personal communication.) and a volcanic ash layer (Dunbar, 2012) are consistent with this interpretation. A subaerially erupted subglacial volcano, (Mt Thiel), about 100 km distant, may be the ash source. Aeromagnetic method most useful to study subglacial volcanic rocks beneath WAIS. The Central West Antarctica aerogeophysical survey is a unique Antarctic data set. Data indicate ~ 1000 magnetic anomalies mostly from subglacial volcanic eruptions.
14. Joughin, Ian, et al. „Basal conditions for Pine Island and Thwaites Glaciers, West Antarctica, determined using satellite and airborne data.“ Journal of Glaciology 55.190 (2009): 245-257. We use models constrained by remotely sensed data from Pine Island and Thwaites Glaciers, West Antarctica, to infer basal properties that are difficult to observe directly. The results indicate strong basal melting in areas upstream of the grounding lines of both glaciers, where the ice flow is fast and the basal shear stress is large. Farther inland, we find that both glaciers have ‘mixed’ bed conditions, with extensive areas of both bedrock and weak till. In particular, there are weak areas along much of Pine Island Glacier’s main trunk that could prove unstable if it retreats past the band of strong bed just above its current grounding line. In agreement with earlier studies, our forward ice-stream model shows a strong sensitivity to small perturbations in the grounding line position. These results also reveal a large sensitivity to the assumed bed (sliding or deforming) model, with non-linear sliding laws producing substantially greater dynamic response than earlier simulations that assume a linear-viscous till rheology. Finally, comparison indicates that our results using a plastic bed are compatible with the limited observational constraints and theoretical work that suggests an upper bound exists on maximum basal shear stress.
Posted by: chaamjamal on: October 16, 2020

You must be logged in to post a comment.