


THIS POST IS A CRITICAL REVIEW OF A PHYS.ORG ARTICLE PUBLISHED IN OCTOBER 2020 SAYING THAT GLOBAL WARMING IS DRIVING ANTARCTIC ICE MELT AND GLOBAL SEA LEVEL RISE FASTER THAT PREVIOUSLY THOUGHT. LINK TO THE PHYS.ORG ARTICLE: https://phys.org/news/2020-10-ice-underestimate-antarctic-contribution-sea.html THIS ASSEESSMENT IS CREDITED TO RESEARCH BY MATTHEW CARROLL OF PENN STATE {PHOTO}.

PART-1: WHAT THE REFERENCE ARTICLE SAYS
Ice melt projections may underestimate Antarctic contribution to sea level rise: by Matthew Carroll, Pennsylvania State University. Published in the journal Climate Dynamics
Fluctuations in the weather can have a significant impact on melting Antarctic ice, and models that do not include this factor can underestimate the global impact of sea level rise. We know ice sheets are melting as global temperatures increase, but uncertainties remain about how much and how fast that will happen. Our findings shed new light on one area of uncertainty, suggesting climate variability has a significant impact on melting ice sheets in Antarctica and the consequent sea level rise.
While it is understood that continued warming may cause rapid ice loss, models that predict how Antarctica will respond to climate change have not included the potential impacts of internal climate variability, like yearly and decadal fluctuations in the climate. Accounting for internal climate variability caused models to predict an additional 7 to 11 centimeters of sea level rise by 2100. The models projected roughly 27 to 38 centimeters of sea level rise during that same period without climate variability.
The increase of 7-11cm is comparable to the amount of sea level rise we have seen over the last few decades. Every bit adds on to the storm surge which we expect to see during hurricanes and other severe weather events, and the results can be devastating.
The Antarctic ice sheet is a complex system, and modeling how it will evolve under future climate conditions requires thousands of simulations and large amounts of computing power. Because of this, modelers test how the ice will respond using a mean temperature found by averaging the results of climate models.
However, that process smooths out peaks caused by internal climate variability and reduces the average number of days above temperature thresholds that can impact the ice sheet melt, creating a bias in the results. If we include variability in the simulations, we are going to have more warm days and more sunshine, and therefore when the daily temperature gets above a certain threshold it will melt the ice. If we’re just running with average conditions, we’re not seeing these extremes happening on yearly or decadal timescales.
To study the effects of internal climate variability, the researchers analyzed two large ensembles of climate simulations. Large ensembles are generated by starting each member with slightly different initial conditions. The chaotic nature of the climate system causes each member to yield slightly different responses, and this represents internally generated variability, the scientists said.
Instead of averaging the results of each ensemble, the scientists fed the atmospheric and oceanic data representing this variability into a three-dimensional Antarctic ice sheet model. They found atmospheric variations had a larger and more immediate impact on the ice sheet, but ocean variability was also a significant factor.
Extensive parts of the ice sheet are in contact with ocean water, and previous studies have suggested that warming oceans could cause large chunks to break away. The process may expose ice cliffs so tall that they collapse under their own weight, inducing a domino effect that further depletes the ice shelf.
The scientists found model simulations that did not include the effects of internal climate variability significantly delayed the retreat of the ice sheet by up to 20 years and underestimated future sea level rise.
“This additional ice melt will impact the hurricane storm surges across the globe. Additionally, for years, the IPCC reports have been looking at sea level rise without considering this additional variability and have been underestimating what the impact may be. It’s important to better understand these processes contributing to the additional ice loss because the ice sheets are melting much faster than we expected.
PART-2: CRITICAL COMMENT#1: Global warming in Antarctica
- In a related post, LINK: ttps://tambonthongchai.com/2020/06/22/global-warming-1979-2019/ it is shown with satellite temperature data that in the 40-year period 1979-2019, the global mean temperature had warmed at a rate of 1.3C per century, the Tropics by 1.2C per century, the North Polar region (the Arctic) by 2.57C per century, and the South Polar region (Antarctic) by 0.16C per century. Comparing the two polar regions with the global mean, we find that the the North Polar Region warmed at almost twice the rate of the global mean while the South Polar Region warmed at a rate of about 12% of the global mean temperature. These data show us that there isn’t a lot of anthropogenic global warming and climate change in Antarctica to cause the ice there to melt.

PART-3: CRITICAL COMMENT#2: Geological Considerations:
YET, THERE ARE SIGNIFICANT ICE MELT EVENTS IN ANTARCTICA THAT RAISES A SEA LEVEL RISE CONCERN AMONG CLIMATE CHANGE RESEARCHERS. There are two very different explanations for this phenomenon. They are (1) an AGW explanation by climate change science, and (2) a geological explanation in the context of the known geological features of Antarctica. That the ice melt events in Antarctica are in the form of isolated events rather than trends, is consistent with the geological explanation. Both explanations acknowledge and cite the relative warmth of the deep Antarctic Circumpolar Current system (ACC) but offer different explanations for its relative warmth.
The AGW theory of ice melt in Antarctica: AGW warm tropical waters are carried to the the Antarctic through prevailing ocean currents. This is the heat source that warms the the Antarctic Circumpolar Current (ACC). The warm ACC in turn melts glaciers and ice shelves from below. The ACC is depicted graphically in the images below. Where the ACC runs into the continental shelf it creates turbulent localized smaller circulations called gyres. The two major gyres in the ACC are the Weddel Gyre and the Ross Sea Gyre as seen in the charts below.
![Turbulence in a climate model simulation of the Antarctic Circumpolar Current [OC] - GIF on Imgur](https://i0.wp.com/i.imgur.com/Tp3aDb2.gif?w=723&ssl=1)

That tropical waters warm the ACC does make sense in terms of prevailing currents, temperature (Tropics 30C ACC 5C) ,and salinity (Tropics 37 ACC 34), but causation for the relative warmth of the ACC is a contentious issue because of the greater and more accessible sources of heat in Antarctica itself as seen in the geothermal heat map and bibliography below. Thus, although it is physically possible for ocean currents from the Tropics to cause warming of the Antarctic, geothermal heat in this region can’t be overlooked and their role in ice melt events must be considered because ice melt in Antarctica is not found as long term trends but as isolated and apparently unrelated events.
The relevant geological features of Antarctica are described in a related post LINK: https://tambonthongchai.com/2019/06/27/antarctica/ with specific reference to the West Antarctic Rift system (WAR), the Marie Byrd Mantle Plume, and the localization of Antarctic ice melt events to these regions. It should be mentioned in this regard that Antarctica attracts significant tourism mostly from South America with a primary tourism destination being the South Shetland Island portion of the WAR where we find one of the most active volcanoes in Antarctica called the Deception Island Collapse Caldera. A collapse caldera is what’s left when a volcano erupts so violently that the center of it collapses and then fills with water kept hot with geothermal heat where tourists can soak and relax in nature’s hot tub as seen in the image below.

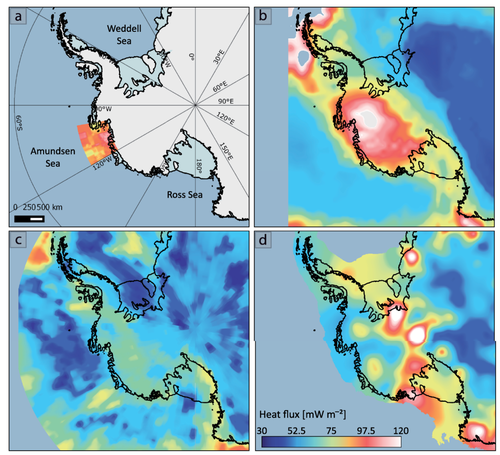
GEOTHERMAL HEAT MAP OF THE ANTARCTIC (Martos etal 2017)


PART-4: CRITICAL COMMENT#3: WHAT DOES UNCERTAINTY MEAN?
The essential issue of this research paper is that climate model predictions of warming and ice melt tell us only the impact of AGW climate change that acts only over long periods of time and only over a global geographical span or significant latitudinal sections thereof. Over brief time spans such as annual or decadal and in geographically localized regions, the impact of AGW climate change cannot be detected because of internal climate variability. As described in a related post LINK https://tambonthongchai.com/2020/07/16/the-internal-variability-issue/ The essence of the internal climate variability issue is that “Internal variability in the climate system confounds assessment of human-induced climate change and imposes irreducible limits on the accuracy of climate change projections, especially at regional and decadal scales“.
The relevant information here is that internal climate variability imposes an additional level of uncertainty in climate change forecasts for short term or localized climate. Here, the Penn State authors of the research paper have interpreted uncertainty in a way that inserts circular reasoning and confirmation bias into the research findings. As explained in a related post LINK: https://tambonthongchai.com/2020/04/22/climate-science-uncertainty/ . “UNCERTAINTY DOES NOT MEAN OH! LOOK HOW HIGH IT COULD BE. IT MEANS WE DON’T REALLY KNOW. THE LESS WE KNOW THE HIGHER IT COULD BE AND IN PERFECT IGNORANCE IT COULD BE AS HIGH AS INFINITY BECAUSE THE ANSWER IS NOT CONSTRAINED BY INFORMATION“.
This logic is fatally flawed but is common in climate science where it is a tradition to express uncertainty not as standard deviation or variance but as a confidence interval that shows how high and how low it could possibly be and that in turn invites a biased interpretation of these numbers. The additional amount of sea level rise attributed to uncertainty in the Penn State research paper is thus rejected on these fundamental statistical considerations.
THE OTHER ERROR IN THIS WORK IS THAT INTERNAL CLIMATE VARIABILITY IS NOT AGW CLIMATE CHANGE AND THE IMPACTS OF INTERNAL CLIMATE VARIABILITY CANNOT BE INTERPRETED AS SOMETHING CAUSED BY FOSSIL FUEL EMISSIONS THAT CAN BE MODERATED WITH CLIMATE ACTION IN THE FORM OF CUTTING OR ELIMINATING FOSSIL FUEL EMISSIONS.
IN CONCLUSION, WE FIND THAT THE PENN STATE RESEARCH THAT INTERPRETED INTERNAL CLIMATE VARIABILITY AS UNCERTAINTY IN AGW CLIMATE CHANGE AND THEN INTERPRETD UNCERTAINTY AS “OH LOOK HOW HIGH IT COULD BE”, IS FATALLY STATISTICALLY FLAWED AND IS REJECTED ON THIS BASIS.
RELATED POST ON CONFIRMATION BIAS IN CLIMATE CHANGE RESEARCH: LINK: https://tambonthongchai.com/2018/08/03/confirmationbias/


GEOTHERMAL HEAT FLUX BIBLIOGRAPHY
- Scambos, Ted A., et al. “The link between climate warming and break-up of ice shelves in the Antarctic Peninsula.” Journal of Glaciology 46.154 (2000): 516-530. A review of in situ and remote-sensing data covering the ice shelves of the Antarctic Peninsula provides a series of characteristics closely associated with rapid shelf retreat: deeply embayed ice fronts; calving of myriad small elongate bergs in punctuated events; increasing flow speed; and the presence of melt ponds on the ice-shelf surface in the vicinity of the break-ups. As climate has warmed in the Antarctic Peninsula region, melt-season duration and the extent of ponding have increased. Most break-up events have occurred during longer melt seasons, suggesting that meltwater itself, not just warming, is responsible. Regions that show melting without pond formation are relatively unchanged. Melt ponds thus appear to be a robust harbinger of ice-shelf retreat. We use these observations to guide a model of ice-shelf flow and the effects of meltwater. Crevasses present in a region of surface ponding will likely fill to the brim with water. We hypothesize (building on Weertman (1973), Hughes (1983) and Van der Veen (1998)) that crevasse propagation by meltwater is the main mechanism by which ice shelves weaken and retreat. A thermodynamic finite-element model is used to evaluate ice flow and the strain field, and simple extensions of this model are used to investigate crack propagation by meltwater. The model results support the hypothesis.
- Convey, P., et al. “The flora of the South Sandwich Islands, with particular reference to the influence of geothermal heating.” Journal of Biogeography 27.6 (2000): 1279-1295. Data obtained in 1997 are combined with updated records from the only previous survey (in 1964) to provide a baseline description of the flora of the archipelago, which currently includes 1 phanerogam, 38 mosses, 11 liverworts, 5 basidiomycete fungi, 41 lichenised fungi and 16 diatoms with, additionally, several taxa identified only to genus. Major elements of the moss and liverwort floras are composed of South American taxa (32% and 73%, respectively), with a further 45% of mosses having bipolar or cosmopolitan distributions. These two groups show low levels of Antarctic endemicity (11% and 18%, respectively). In contrast, 52% of lichens and 80% of basidiomycete fungi are endemic to the Antarctic. A further 36% of lichens are bipolar/cosmopolitan, with only 5% of South American origin. The flora of the South Sandwich Islands is clearly derived from those of other Antarctic zones. The flora of unheated ground is closely related to that of the maritime Antarctic, although with a very limited number of species represented. That of heated ground contains both maritime and sub‐Antarctic elements, confirming the importance of geothermal heating for successful colonisation of the latter group. The occurrence of several maritime Antarctic species only on heated ground confirms the extreme severity of the archipelago’s climate in comparison with well‐studied sites much further south in this biogeographical zone.
- Smith, RI Lewis. “The bryophyte flora of geothermal habitats on Deception Island, Antarctica.” The Journal of the Hattori Botanical Laboratory 97 (2005): 233-248. Deception Island is one of the most volcanically active sites south of 60°S. Between 1967 and 1970 three major eruptions devastated large expanses of the landscape and its predominantly cryptogamic vegetation. Since 1970 extensive recolonisation has occurred on the more stable surfaces. Unheated ground supports several bryophyte and lichen communities typical of much of the maritime Antarctic, but geothermal habitats possess remarkable associations of bryophytes, many of the species being unknown or very rare elsewhere in the Antarctic. Nine geothermal sites were located and their vegetation investigated in detail. Communities associated with more transient sites have disappeared when the geothermal activity ceased. Mosses and liverworts occur to within a few centimetres of fumarole vents where temperatures reach 90-95℃, while temperatures within adjacent moss turf can reach 35-50℃ or more and remain consistently between 25 and 45℃. Most of the bryoflora has a Patagonian-Fuegian provenance and it is presumed that, unlike most species, the thermophiles are not pre-adapted to the Antarctic environment, being able to colonise only where the warm and humid conditions prevail.
- Vieira, Gonçalo, et al. “Geomorphological observations of permafrost and ground-ice degradation on Deception and Livingston Islands, Maritime Antarctica.” (2008): 1939-1844. The Antarctic Peninsula is experiencing one of the fastest increases in mean annual air temperatures (ca. 2.5oC in the last 50 years) on Earth. If the observed warming trend continues as indicated by climate models, the region could suffer widespread permafrost degradation. This paper presents field observations of geomorphological features linked to permafrost and ground-ice degradation at two study areas: northwest Hurd Peninsula (Livingston Island) and Deception Island along the Antarctic Peninsula. These observations include thermokarst features, debris flows, active-layer detachment slides, and rockfalls. The processes observed may be linked not only to an increase in temperature, but also to increased rainfall, which can trigger debris flows and other processes. On Deception Island some thermokarst (holes in the ground produced by the selective melting of permafrost) features may be related to anomalous geothermal heat flux from volcanic activity.
- Mulvaney, Robert, et al. “Recent Antarctic Peninsula warming relative to Holocene climate and ice-shelf history.” Nature 489.7414 (2012): 141-144. Rapid warming over the past 50 years on the Antarctic Peninsula is associated with the collapse of a number of ice shelves and accelerating glacier mass loss1,2,3,4,5,6,7. In contrast, warming has been comparatively modest over West Antarctica and significant changes have not been observed over most of East Antarctica8,9, suggesting that the ice-core palaeoclimate records available from these areas may not be representative of the climate history of the Antarctic Peninsula. Here we show that the Antarctic Peninsula experienced an early-Holocene warm period followed by stable temperatures, from about 9,200 to 2,500 years ago, that were similar to modern-day levels. Our temperature estimates are based on an ice-core record of deuterium variations from James Ross Island, off the northeastern tip of the Antarctic Peninsula. We find that the late-Holocene development of ice shelves near James Ross Island was coincident with pronounced cooling from 2,500 to 600 years ago. This cooling was part of a millennial-scale climate excursion with opposing anomalies on the eastern and western sides of the Antarctic Peninsula. Although warming of the northeastern Antarctic Peninsula began around 600 years ago, the high rate of warming over the past century is unusual (but not unprecedented) in the context of natural climate variability over the past two millennia. The connection shown here between past temperature and ice-shelf stability suggests that warming for several centuries rendered ice shelves on the northeastern Antarctic Peninsula vulnerable to collapse. Continued warming to temperatures that now exceed the stable conditions of most of the Holocene epoch is likely to cause ice-shelf instability to encroach farther southward along the Antarctic Peninsula.
- Fraser, Ceridwen I., et al. “Geothermal activity helps life survive glacial cycles.” Proceedings of the National Academy of Sciences 111.15 (2014): 5634-5639. The evolution and maintenance of diversity through cycles of past climate change have hinged largely on the availability of refugia (places where life can survive through a period of unfavorable conditions such as glaciation). Geothermal refugia may have been particularly important for survival through past glaciations. Our spatial modeling of Antarctic biodiversity indicates that some terrestrial groups likely survived throughout intense glacial cycles on ice-free land or in sub-ice caves associated with areas of geothermal activity, from which recolonization of the rest of the continent took place. These results provide unexpected insights into the responses of various species to past climate change and the importance of geothermal regions in promoting biodiversity. Furthermore, they indicate the likely locations of biodiversity “hotspots” in Antarctica, suggesting a critical focus for future conservation efforts.
- An, Meijian, et al. “Temperature, lithosphere‐asthenosphere boundary, and heat flux beneath the Antarctic Plate inferred from seismic velocities.” Journal of Geophysical Research: Solid Earth 120.12 (2015): 8720-8742. We estimate the upper mantle temperature of the Antarctic Plate based on the thermoelastic properties of mantle minerals and S velocities using a new 3‐D shear velocity model, AN1‐S. Crustal temperatures and surface heat fluxes are then calculated from the upper mantle temperature assuming steady state thermal conduction. The temperature at the top of the asthenosphere beneath the oceanic region and West Antarctica is higher than the dry mantle solidus, indicating the presence of melt. From the temperature values, we generate depth maps of the lithosphere‐asthenosphere boundary and the Curie temperature isotherm. The maps show that East Antarctica has a thick lithosphere similar to that of other stable cratons, with the thickest lithosphere (~250 km) between Domes A and C. The thin crust and lithosphere beneath West Antarctica are similar to those of modern subduction‐related rift systems in East Asia. A cold region beneath the Antarctic Peninsula is similar in spatial extent to that of a flat‐subducted slab beneath the southern Andes, indicating a possible remnant of the Phoenix Plate, which was subducted prior to 10 Ma. The oceanic lithosphere generally thickens with increasing age, and the age‐thickness correlation depends on the spreading rate of the ridge that formed the lithosphere. Significant flattening of the age‐thickness curves is not observed for the mature oceanic lithosphere of the Antarctic Plate.
- Dziadek, Ricarda, et al. “Geothermal heat flux in the Amundsen Sea sector of West Antarctica: New insights from temperature measurements, depth to the bottom of the magnetic source estimation, and thermal modeling.” Geochemistry, Geophysics, Geosystems 18.7 (2017): 2657-2672. [FULL TEXT] Focused research on the Pine Island and Thwaites glaciers, which drain the West Antarctic Ice Shelf (WAIS) into the Amundsen Sea Embayment (ASE), revealed strong signs of instability in recent decades that result from variety of reasons, such as inflow of warmer ocean currents and reverse bedrock topography, and has been established as the Marine Ice Sheet Instability hypothesis. Geothermal heat flux (GHF) is a poorly constrained parameter in Antarctica and suspected to affect basal conditions of ice sheets, i.e., basal melting and subglacial hydrology. Thermomechanical models demonstrate the influential boundary condition of geothermal heat flux for (paleo) ice sheet stability. Due to a complex tectonic and magmatic history of West Antarctica, the region is suspected to exhibit strong heterogeneous geothermal heat flux variations. We present an approach to investigate ranges of realistic heat fluxes in the ASE by different methods, discuss direct observations, and 3‐D numerical models that incorporate boundary conditions derived from various geophysical studies, including our new Depth to the Bottom of the Magnetic Source (DBMS) estimates. Our in situ temperature measurements at 26 sites in the ASE more than triples the number of direct GHF observations in West Antarctica. We demonstrate by our numerical 3‐D models that GHF spatially varies from 68 up to 110 mW m−2.
- Martos, Yasmina M., et al. “Heat flux distribution of Antarctica unveiled.” Geophysical Research Letters 44.22 (2017): 11-417. [FULL TEXT] Antarctica is the largest reservoir of ice on Earth. Understanding its ice sheet dynamics is crucial to unraveling past global climate change and making robust climatic and sea level predictions. Of the basic parameters that shape and control ice flow, the most poorly known is geothermal heat flux. Direct observations of heat flux are difficult to obtain in Antarctica, and until now continent‐wide heat flux maps have only been derived from low‐resolution satellite magnetic and seismological data. We present a high‐resolution heat flux map and associated uncertainty derived from spectral analysis of the most advanced continental compilation of airborne magnetic data. Small‐scale spatial variability and features consistent with known geology are better reproduced than in previous models, between 36% and 50%. Our high‐resolution heat flux map and its uncertainty distribution provide an important new boundary condition to be used in studies on future subglacial hydrology, ice sheet dynamics, and sea level change.
- Burton‐Johnson, Alex, et al. “A new heat flux model for the Antarctic Peninsula incorporating spatially variable upper crustal radiogenic heat production.” Geophysical Research Letters 44.11 (2017): 5436-5446. A new method for modeling heat flux shows that the upper crust contributes up to 70% of the Antarctic Peninsula’s subglacial heat flux and that heat flux values are more variable at smaller spatial resolutions than geophysical methods can resolve. Results indicate a higher heat flux on the east and south of the Peninsula (mean 81 mW m−2) where silicic rocks predominate, than on the west and north (mean 67 mW m−2) where volcanic arc and quartzose sediments are dominant. While the data supports the contribution of heat‐producing element‐enriched granitic rocks to high heat flux values, sedimentary rocks can be of comparative importance dependent on their provenance and petrography. Models of subglacial heat flux must utilize a heterogeneous upper crust with variable radioactive heat production if they are to accurately predict basal conditions of the ice sheet. Our new methodology and data set facilitate improved numerical model simulations of ice sheet dynamics.
Posted by: chaamjamal on: October 11, 2020

You must be logged in to post a comment.