

In something resembling a new pattern for Western Hudson Bay polar bears, most of the animals are still out on the ice in late July this year, just like they were in the 1980s. The same thing happened last year but was brushed off as a happy anomaly. However, after last fall’s 1980s-like early freeze-up, this makes the sixth year in a row of good to very good sea ice conditions for Western Hudson Bay polar bears. No wonder polar bear experts haven’t published these data: good sea ice conditions along with polar bears coming ashore fat and healthy are not just inconvenient – they threaten to destroy the extinction panic narrative that depends on Western Hudson Bay bears showing evidence of harm from reduced sea ice.
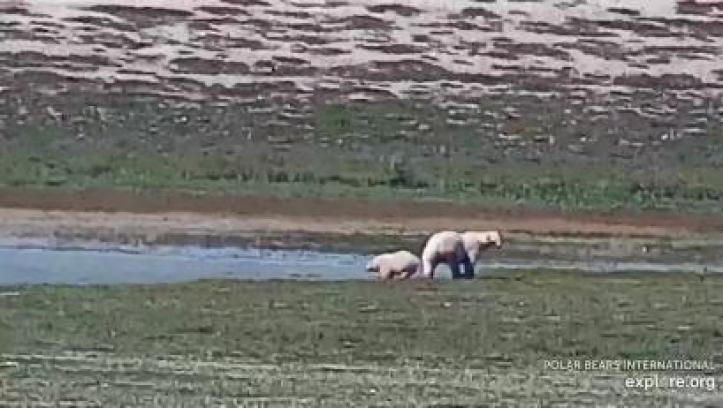
Perhaps the first bear off the Western Hudson Bay ice came ashore just south of Churchill in Wakusp National Park (at ‘Cape East’), 13 July 2020, courtesy Explore.org livecam and was in very good condition.
The first of polar bear researcher Andrew Derocher’s collared bears was reported off the ice on 17 July. A week later (24 July), he reported that only three of his 14 collared WH females had come ashore (see map below).

There was actually far more ice over Hudson Bay on 24 July than the map Derocher presents above because he uses ice charts that display only ice >50% concentration. The Canadian Ice Service extent of ice cover (below) shows ice >15% concentration and explains the tagged bears that appear on Derocher’s map to be in open water:
Stage of development charts for the NW sector below show that the remaining ice is thick first year ice > 1.2m thick (dark green):
The pattern of ice retreat over Hudson Bay this year is remarkably similar to the average for 1971-2000 (see below) calculated by Ian Stirling and colleagues in support of their claim that earlier breakup of sea ice caused by global warming threatens the future survival of Western Hudson Bay polar bears (Stirling et al. 2004):

Below is the mid-July weekly sea ice thickness chart for 2020 showing the overall pattern of ice comparable to the medium grey area in the above figure (note the CIS chart below is rotated clockwise relative to the figure above), where the dark green is thick first year ice >1.2m:

Not since 2009 has there been quite so much thick ice so close to shore at mid-July (below). Polar bears were not off the ice until August in 2009 and were reportedly in good condition and abundant in the area around Churchill.

Except perhaps for 2019, which had almost as much:

In 2018, there was still quite a bit of ice but it was more centrally located:
A search of the CIS archives shows there was enough for some bears to stay on the ice into July from at least 2015. In 2019, Derocher’s collared bears were as late coming off the ice as they have been this year, with many still on the ice as of 27 July (see below).

In other words, this is not the first 1980s-like breakup year for Western Hudson Bay polar bears in recent years (Crockford 2020), as Derocher claimed in his tweet on Saturday (25 July: “Climate change remains the long term threat: 1 normal year doesn’t alter the trends“):https://platform.twitter.com/embed/index.html?dnt=false&embedId=twitter-widget-0&frame=false&hideCard=false&hideThread=false&id=1287075412485390336&lang=de&origin=https%3A%2F%2Fwordpress.com%2Fread%2Ffeeds%2F58485790%2Fposts%2F2829709162&theme=light&widgetsVersion=9066bb2%3A1593540614199&width=550px
In fact, he admitted last year (in August 2019) that the Hudson Bay ice had been “similar to the 80s” and that Western Hudson Bay polar bears had had a “good year” – but then insisted it was the first such good year in decades and thus didn’t count for much.

However, up to the summer of 2019, ice conditions for Western Hudson Bay bears had already been relatively good for the last five years and this year makes it six, since freeze-up in the fall of 2019 was earlier than the 1980’s average for the third year in a row.
How many recent years of sea ice data that does not support the ‘long term trend’ for Western Hudson Bay will change the mind of polar bear biologists? Already, the breakup and freeze-up data has not supported the assumed ever-declining trend if you looked at what’s happened since the late 1990s: the trend was found to be flat between 2001 and 2010 (Lunn et al. 2016) and from 1995-2015 (Castro de la Guardia et al. 2017). Add the unpublished data since 2015 and the slight declining trend since 1979 for the ice-free period (see below) used to support climate change extinction predictions (e.g. Stern and Laidre 2016; Regehr et. al. 2016) and the trend is likely to disappear altogether.

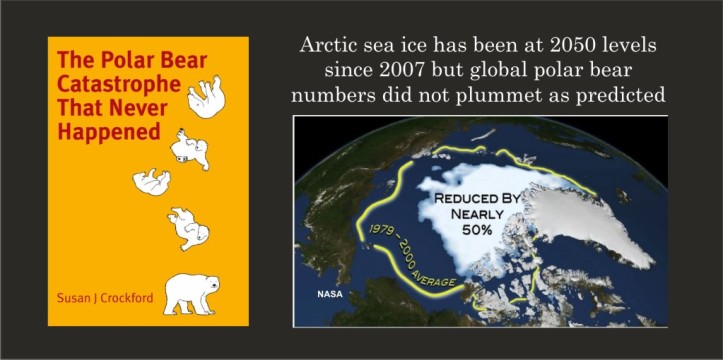
No wonder polar bear researchers have not published the breakup/freeze-up data and associated dates onshore/offshore for polar bears for Western Hudson Bay since 2015. They know it would utterly destroy the public narrative of a catastrophic future for polar bears that’s been pushed for almost two decades despite strong evidence to the contrary, as my most recent book describes.
References
Castro de la Guardia, L., Myers, P.G., Derocher, A.E., Lunn, N.J., Terwisscha van Scheltinga, A.D. 2017. Sea ice cycle in western Hudson Bay, Canada, from a polar bear perspective. Marine Ecology Progress Series 564: 225–233. http://www.int-res.com/abstracts/meps/v564/p225-233/
Crockford, S.J. 2020. State of the Polar Bear Report 2019. Global Warming Policy Foundation Report 39, London. pdf here.
Lunn, N.J., Servanty, S., Regehr, E.V., Converse, S.J., Richardson, E. and Stirling, I. 2016. Demography of an apex predator at the edge of its range – impacts of changing sea ice on polar bears in Hudson Bay. Ecological Applications 26(5):1302-1320. DOI: 10.1890/15-1256
Regehr, E.V., Laidre, K.L, Akçakaya, H.R., Amstrup, S.C., Atwood, T.C., Lunn, N.J., Obbard, M., Stern, H., Thiemann, G.W., & Wiig, Ø. 2016. Conservation status of polar bears (Ursus maritimus) in relation to projected sea-ice declines. Biology Letters 12: 20160556. http://rsbl.royalsocietypublishing.org/content/12/12/20160556 Supplementary data here.
Stern, H.L. and Laidre, K.L. 2016. Sea-ice indicators of polar bear habitat. Cryosphere 10: 2027-2041.
Stirling, I., Lunn, N.J., Iacozza, J., Elliott, C. and Obbard, M. 2004. Polar bear distribution and abundance on the southwestern Hudson Bay coast during open water season, in relation to population trends and annual ice patterns. Arctic 57: 15–26.
via polarbearscience
July 27, 2020 at 10:29AM

You must be logged in to post a comment.